Indicators
Updated:
It detects confluence areas by aggregating:
Volume Profile levels (POC, Value Area, Peaks, Valleys)
Price Action swings (highs and lows)
Trend retracement levels
When several of these elements align within a defined price range, the indicator highlights those zones as potential support or resistance.
Indicator Setup
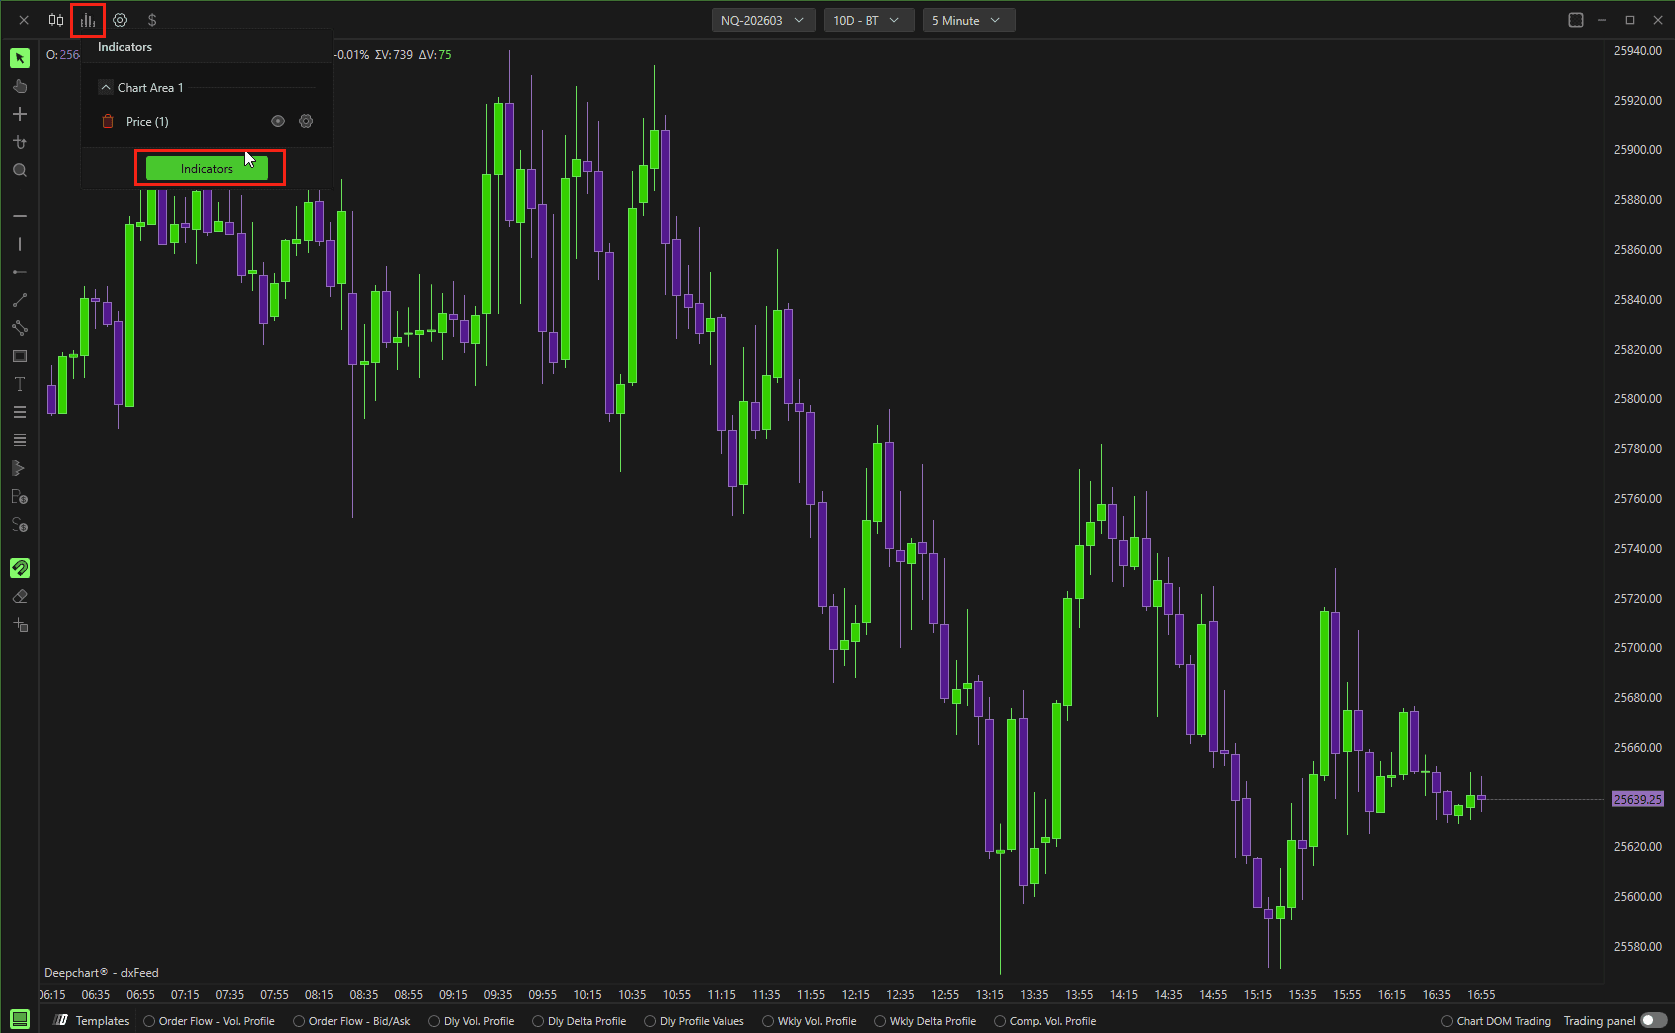
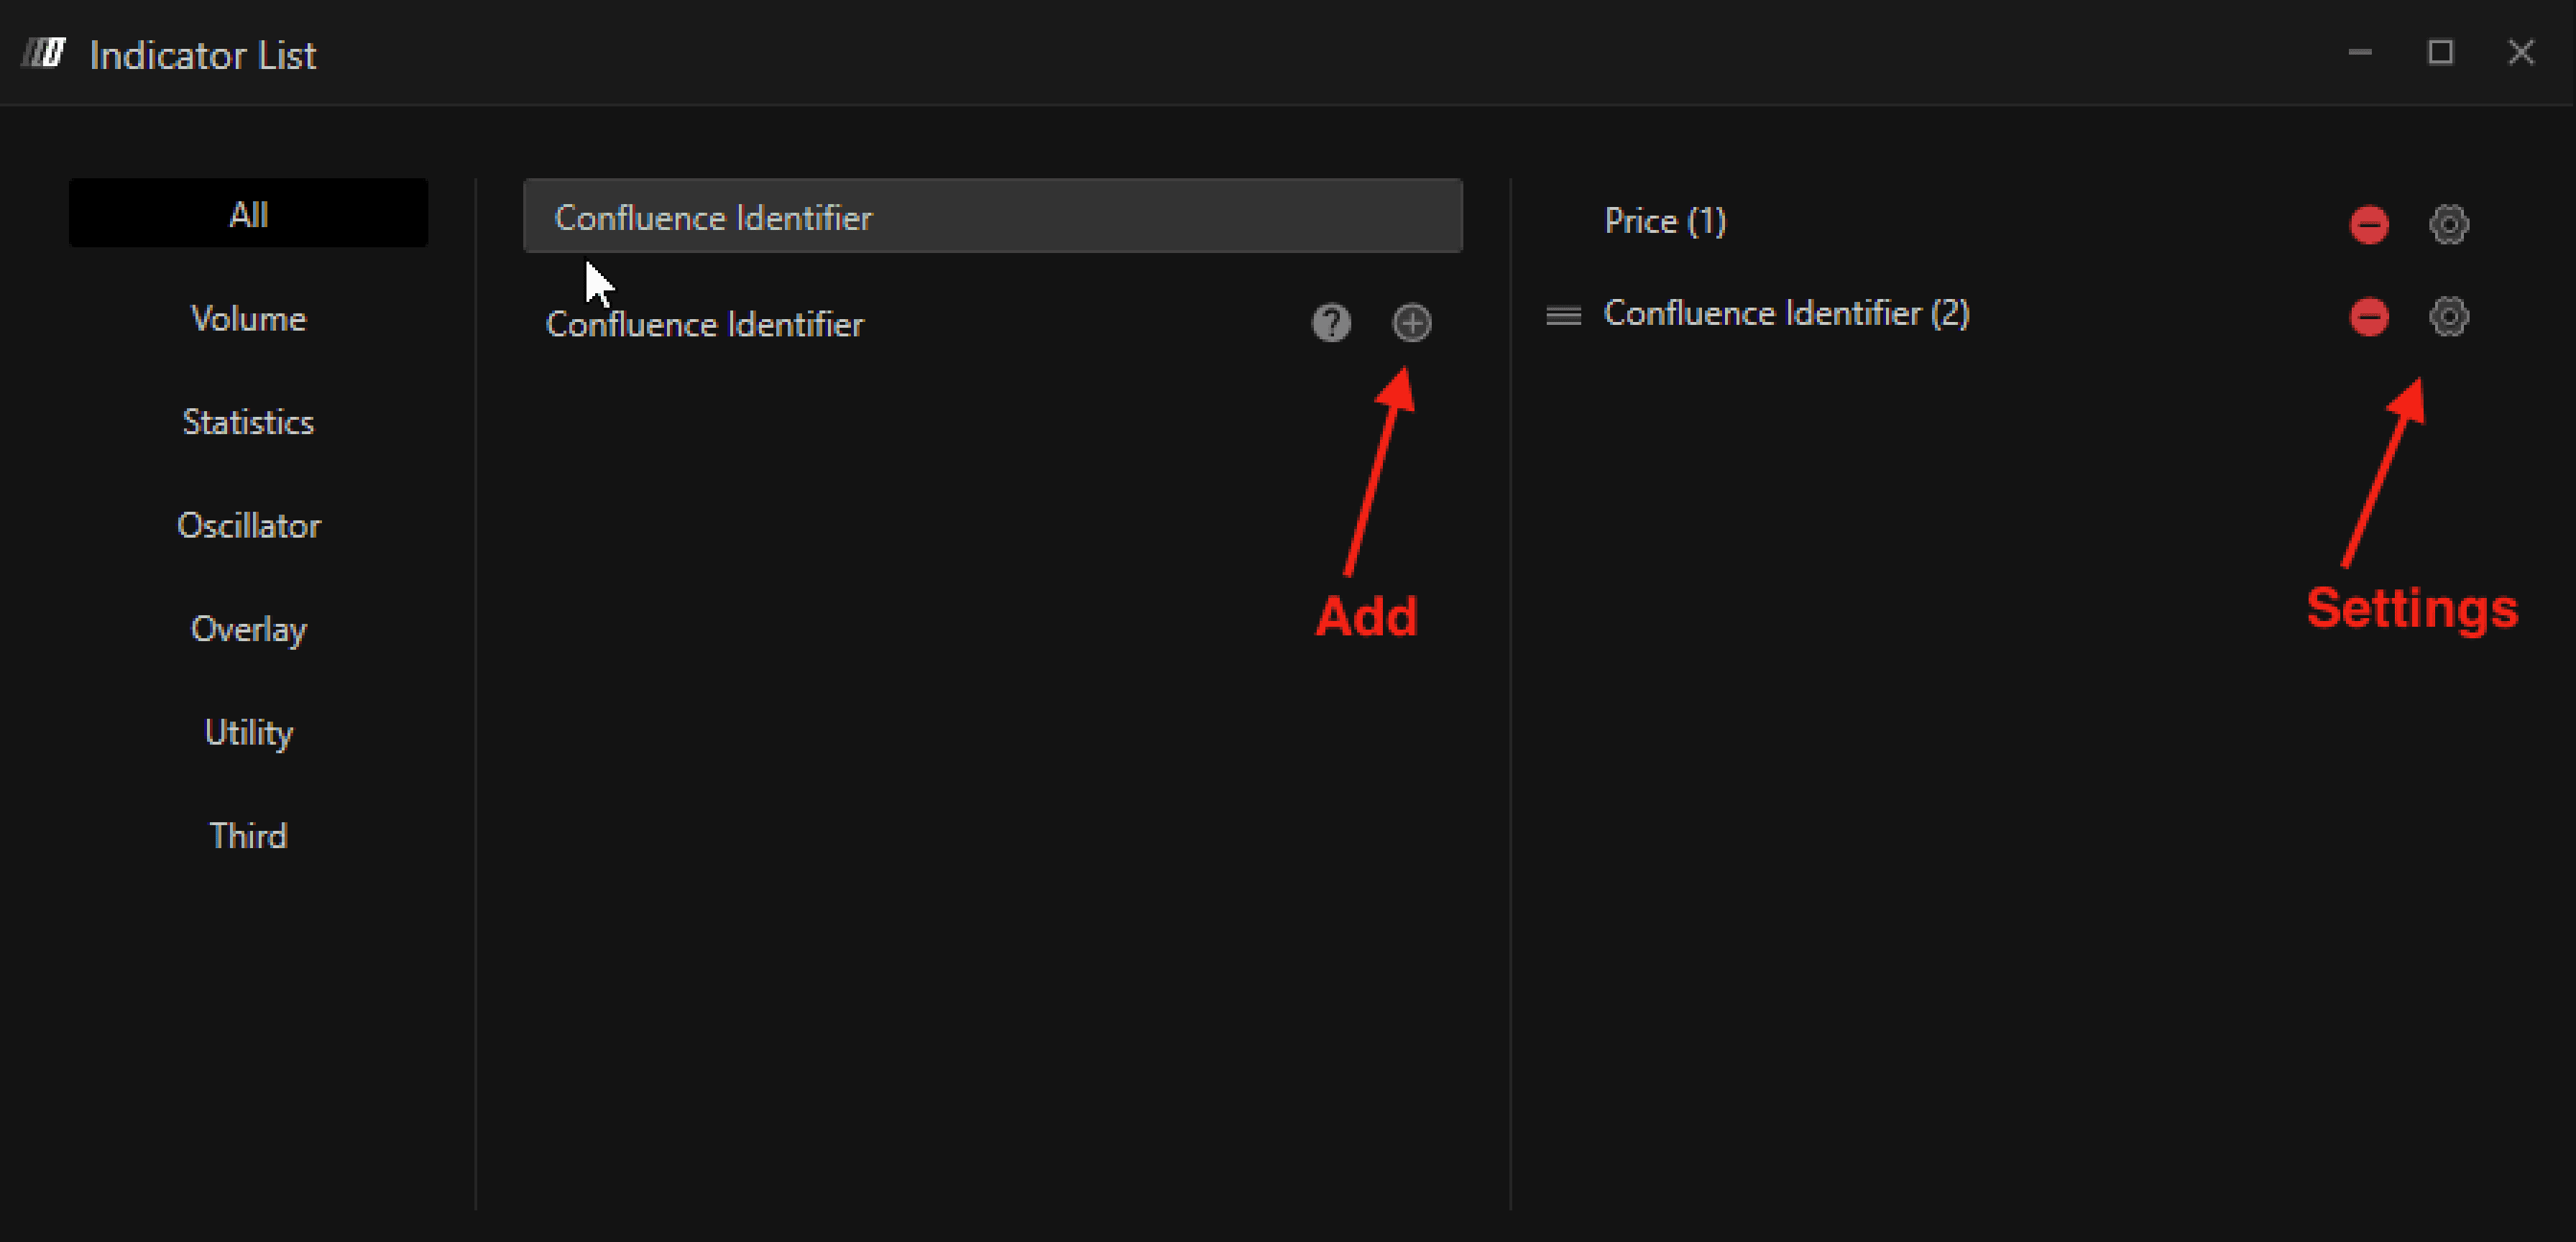
To add the Confluence Identifier:
Open the Indicators menu
Add Confluence Identifier
Click the Settings icon to configure the indicator
Data Settings
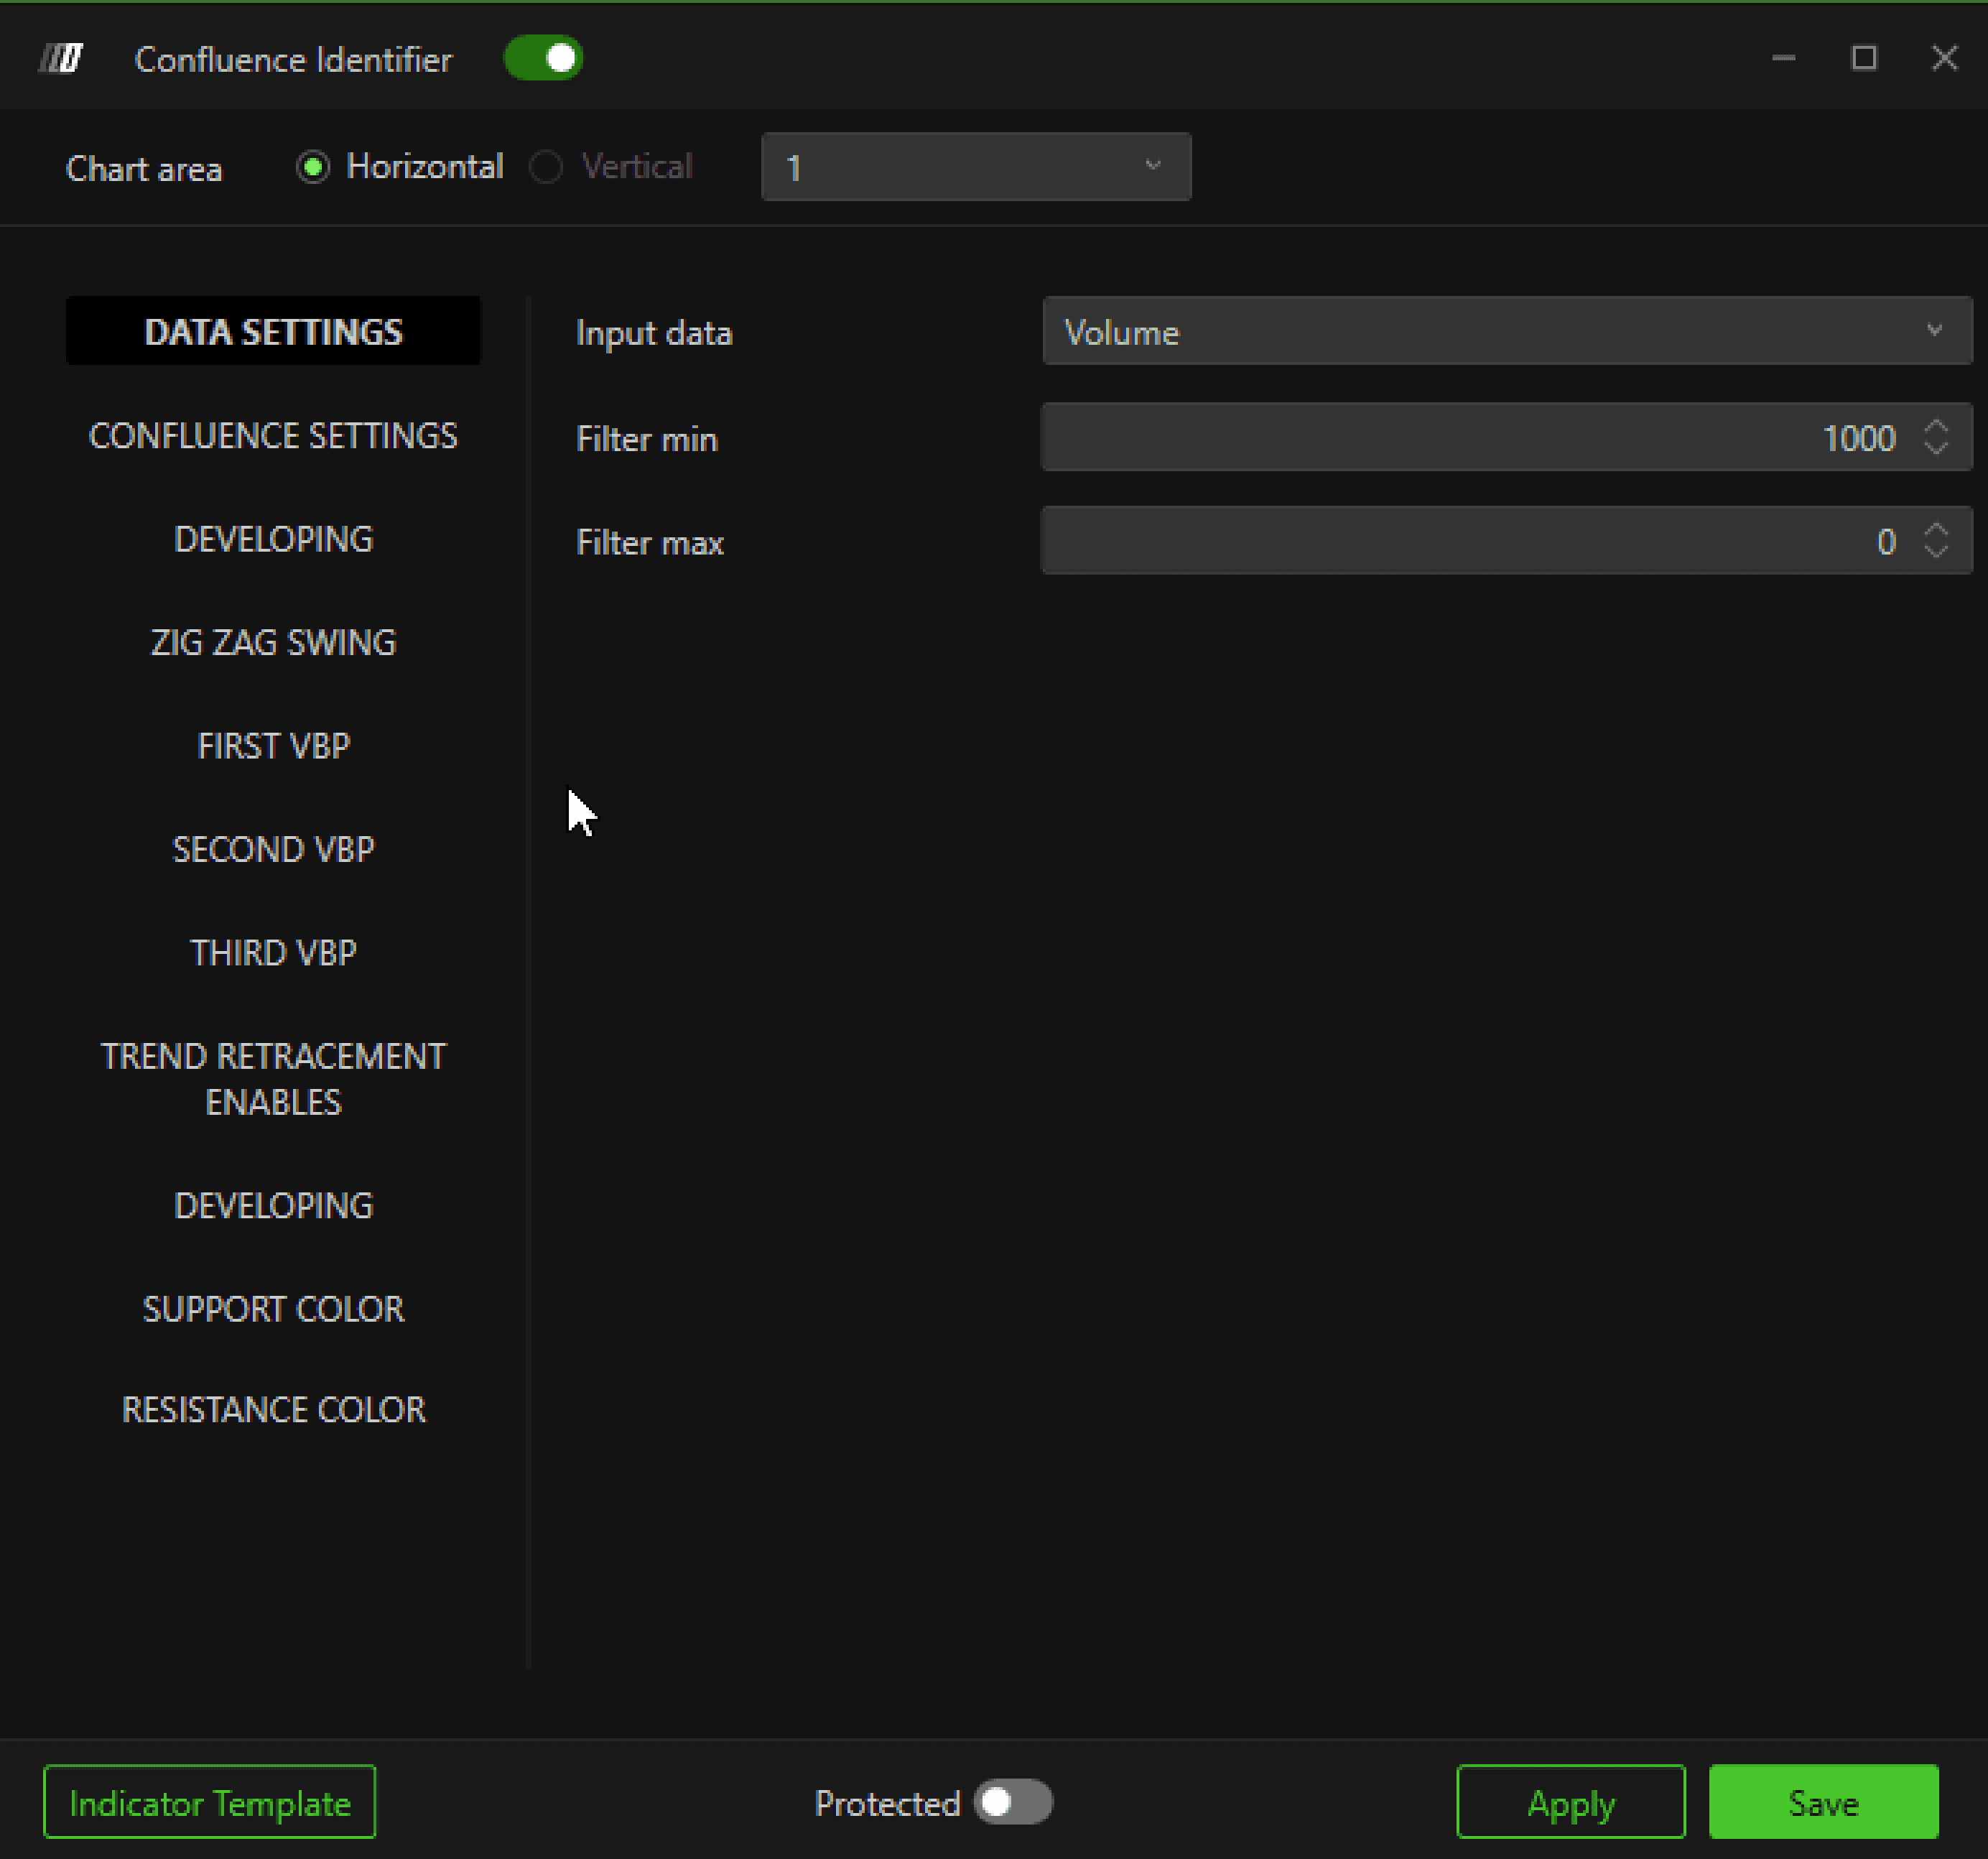
Input Data
Defines the data source used for calculations:
Volume
Measures the traded volume at each price level.Orders
Measures the number of executed orders.
Filter Settings
Filter Min
Applies a minimum threshold to filter out insignificant values.
Filter Max
Applies a maximum threshold.
If set to 0, no maximum filter is applied.
Confluence Settings
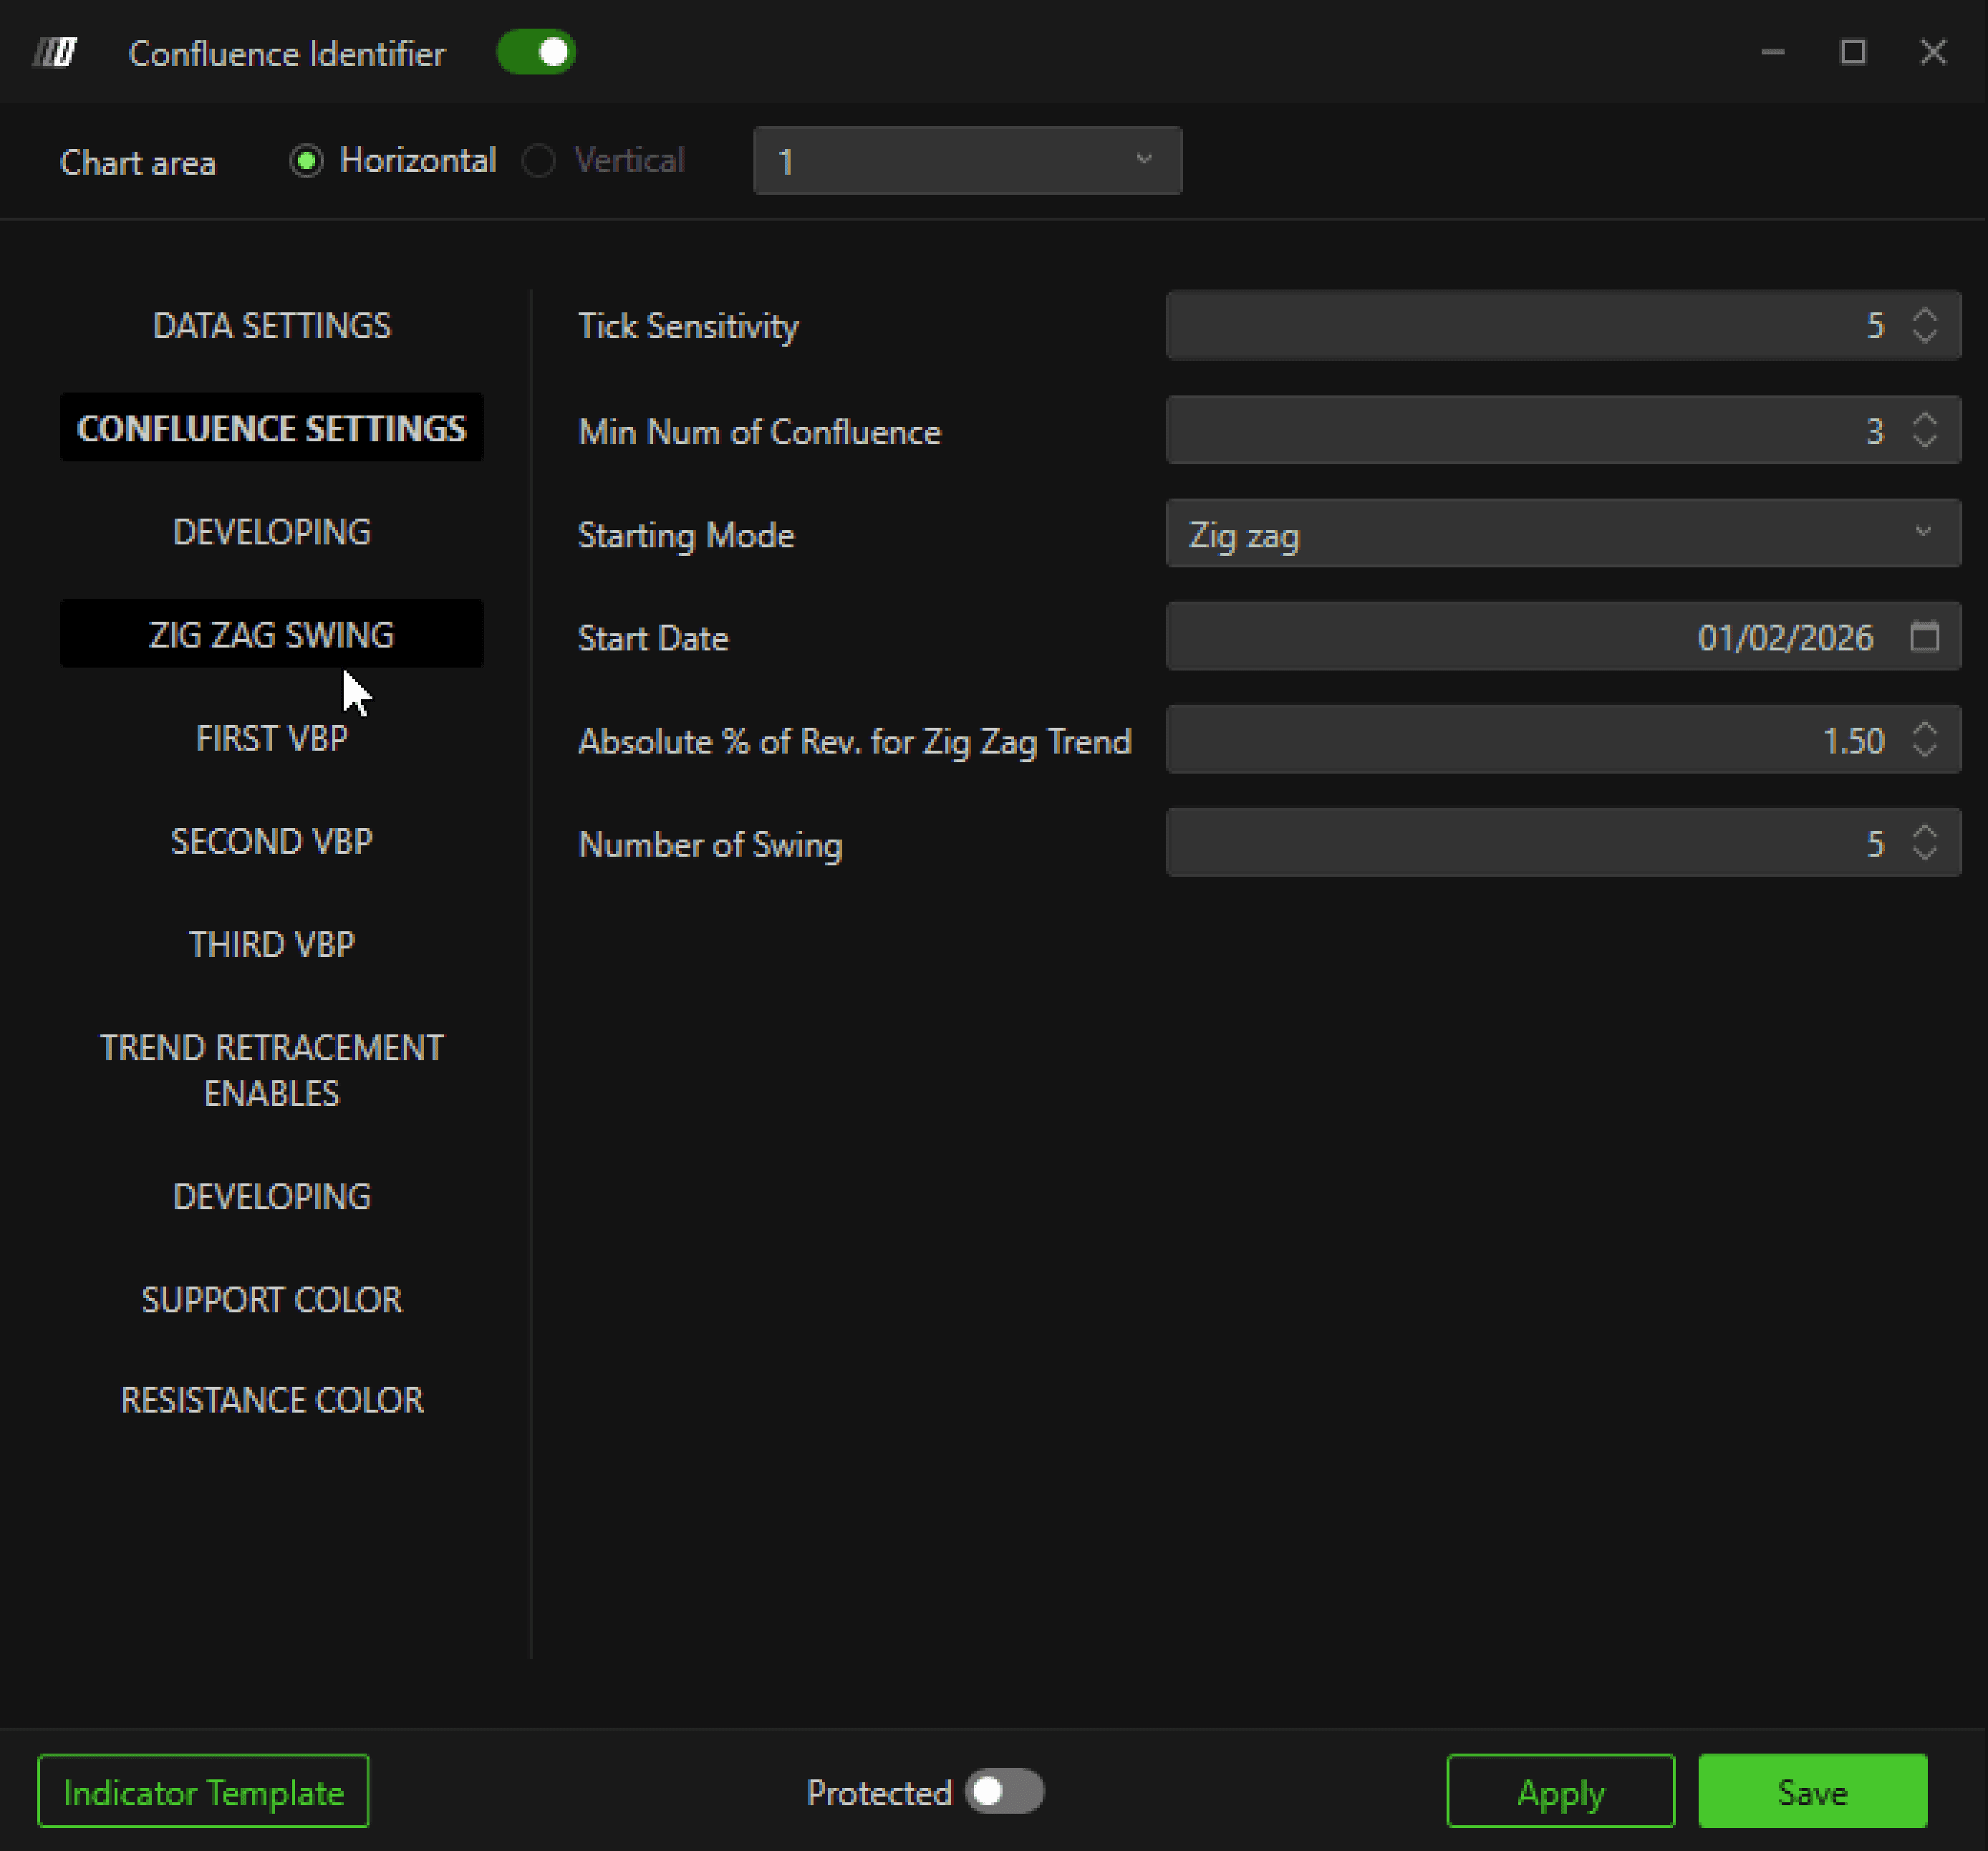
Tick Sensitivity
Defines the price range (in ticks) within which different elements must align to be considered a confluence.
Smaller values = more precise zones
Larger values = broader zones
Minimum Number of Confluences
Specifies how many elements must align to generate a confluence zone.
Higher values → fewer but stronger zones
Lower values → more frequent zones
Starting Mode
Defines how the calculation starting point is determined:
Zig Zag
Uses price swings based on Zig Zag logic.Date
Starts calculations from a specific date.
Start Date
Defines the date from which confluence calculations begin (used when Date mode is selected).
Absolute % of Reversal for Zig Zag Trend
Defines the minimum price reversal required to identify a swing point in the Zig Zag trend.
Number of Swings
Specifies how many swings are considered when determining the calculation start point.
Zig Zag Swing Settings
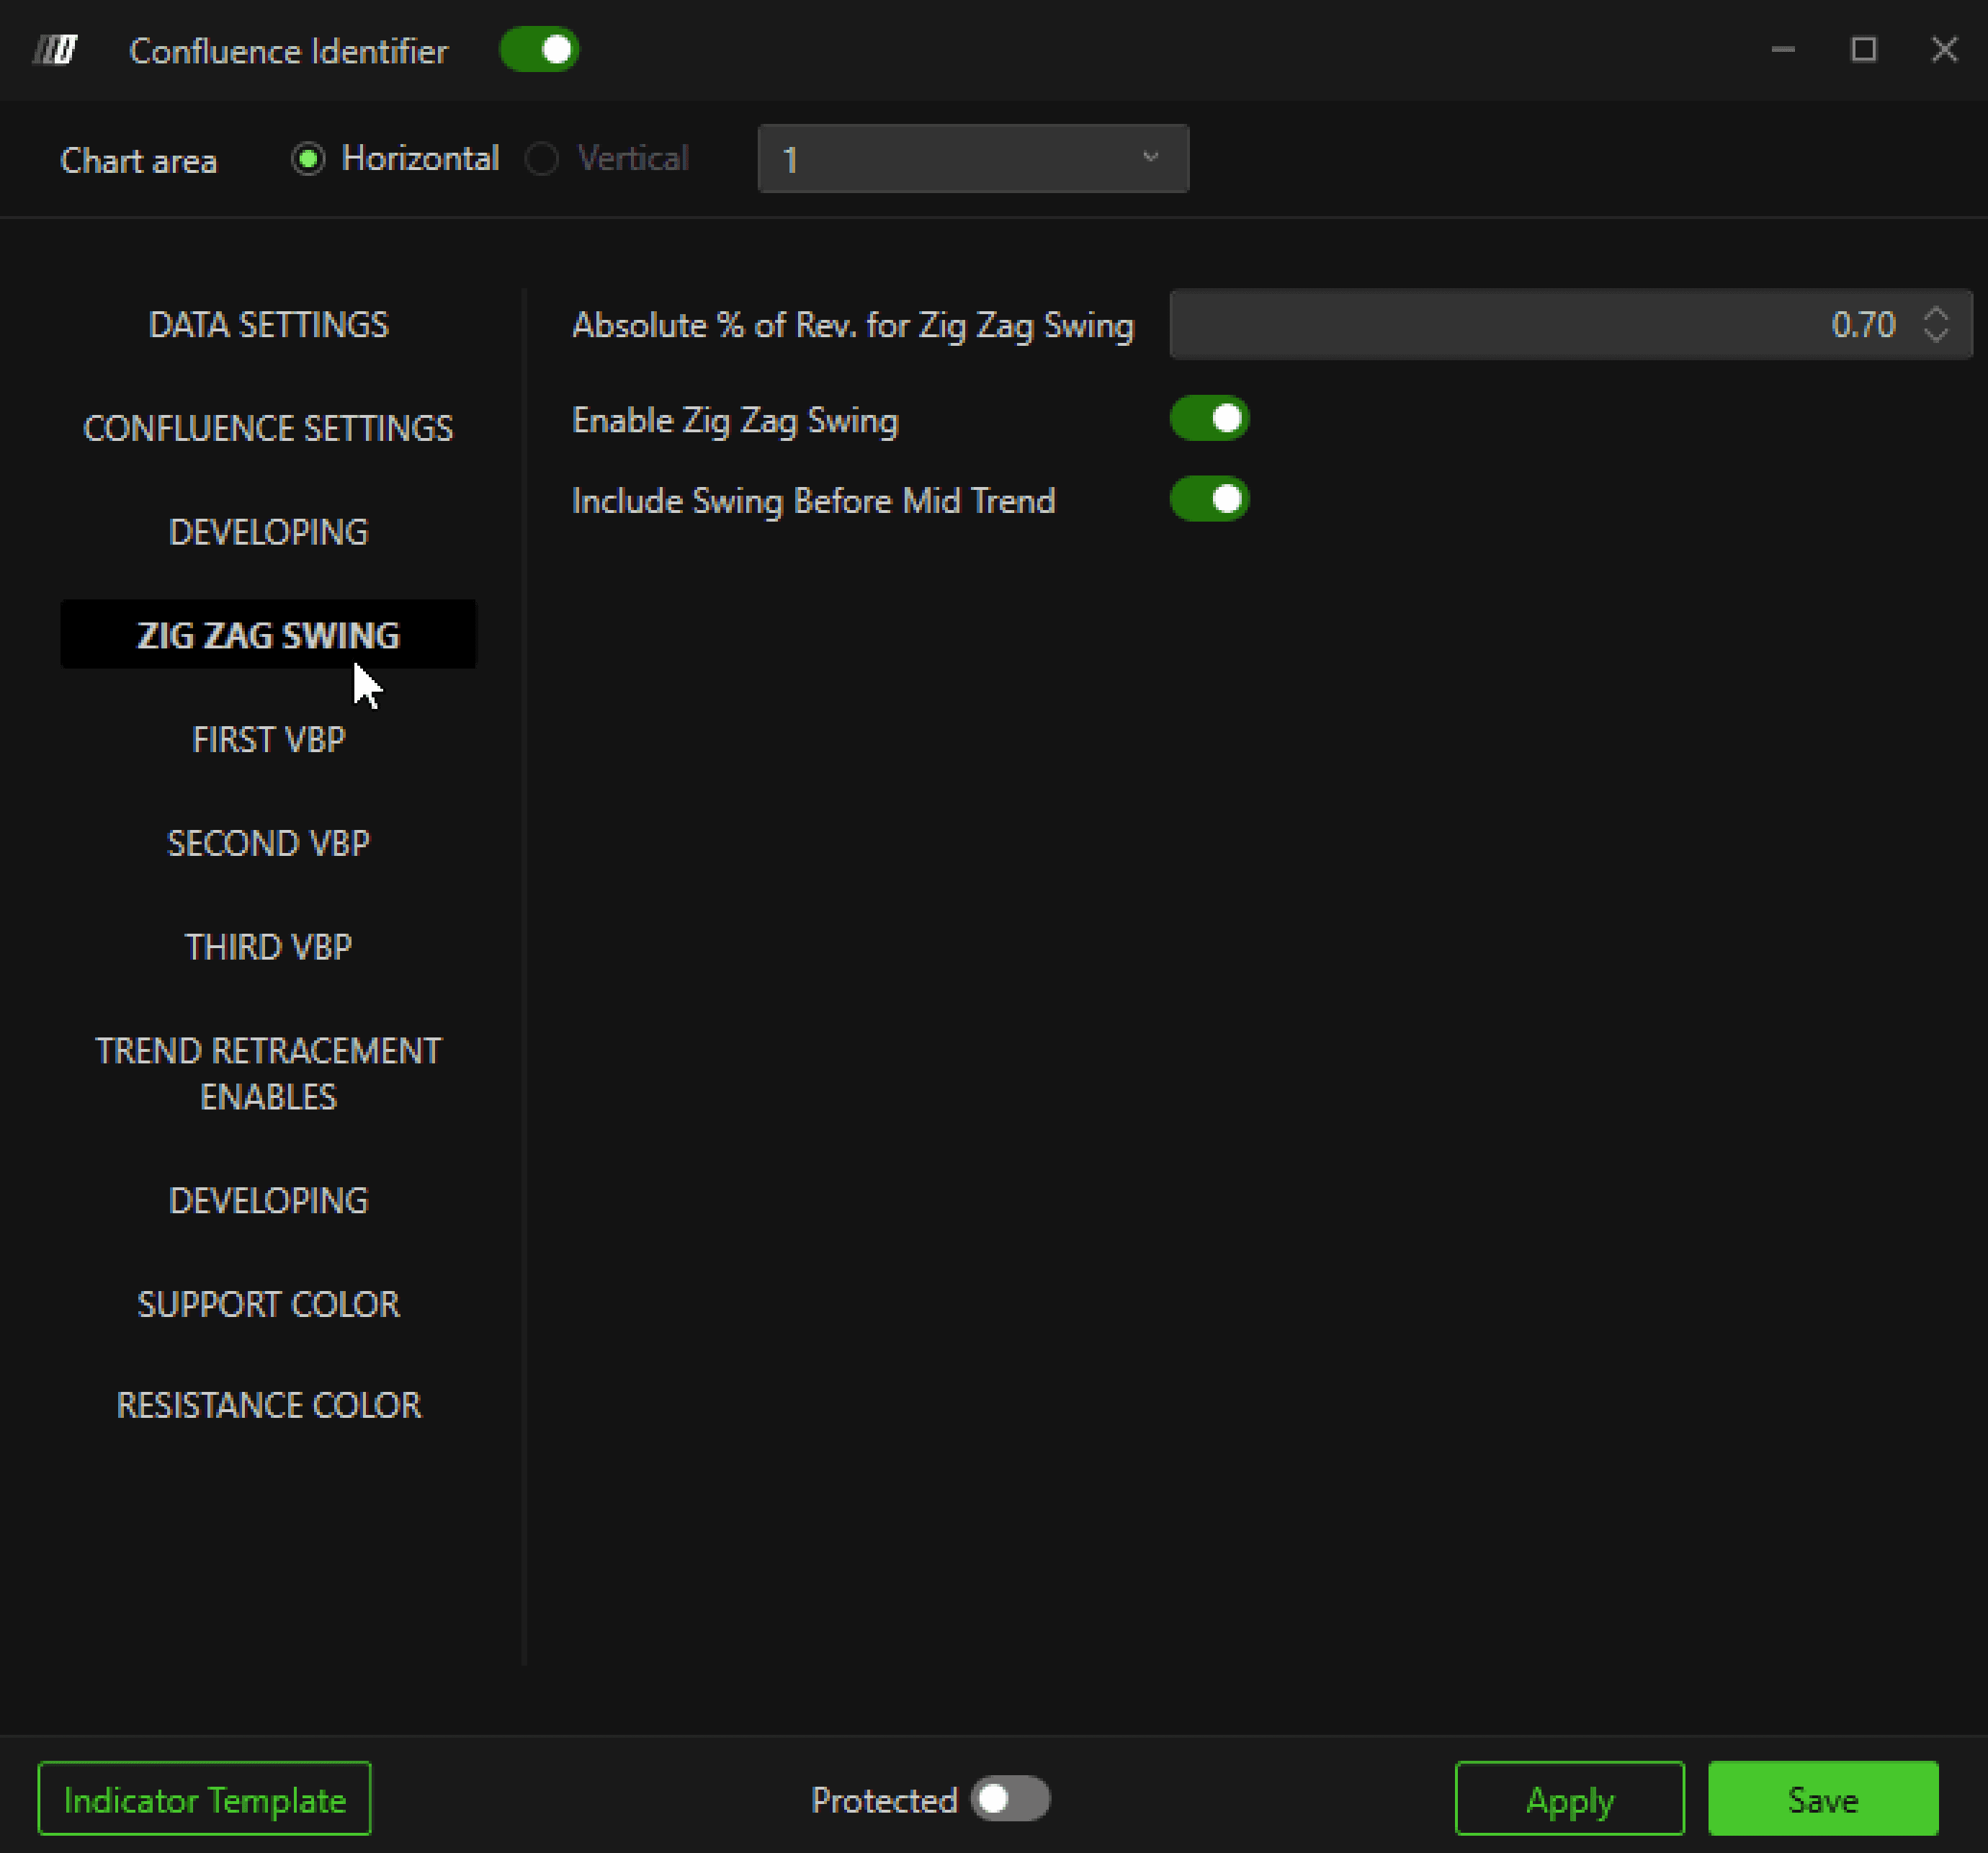
% Absolute Variation for Zig Zag Inversion
Defines the price reversal percentage required to identify swing highs and lows.
Important note:
The first Zig Zag is used only to determine the calculation start date and can use a larger percentage.
The second Zig Zag identifies swings used for confluences and should use a smaller percentage to include minor swings.
Enable Zig Zag Swing
Includes swing highs and lows in the confluence calculation.
Include Swings in the First Half
Enabled: Includes older (less recent) swing points
Disabled: Considers only the most recent swings
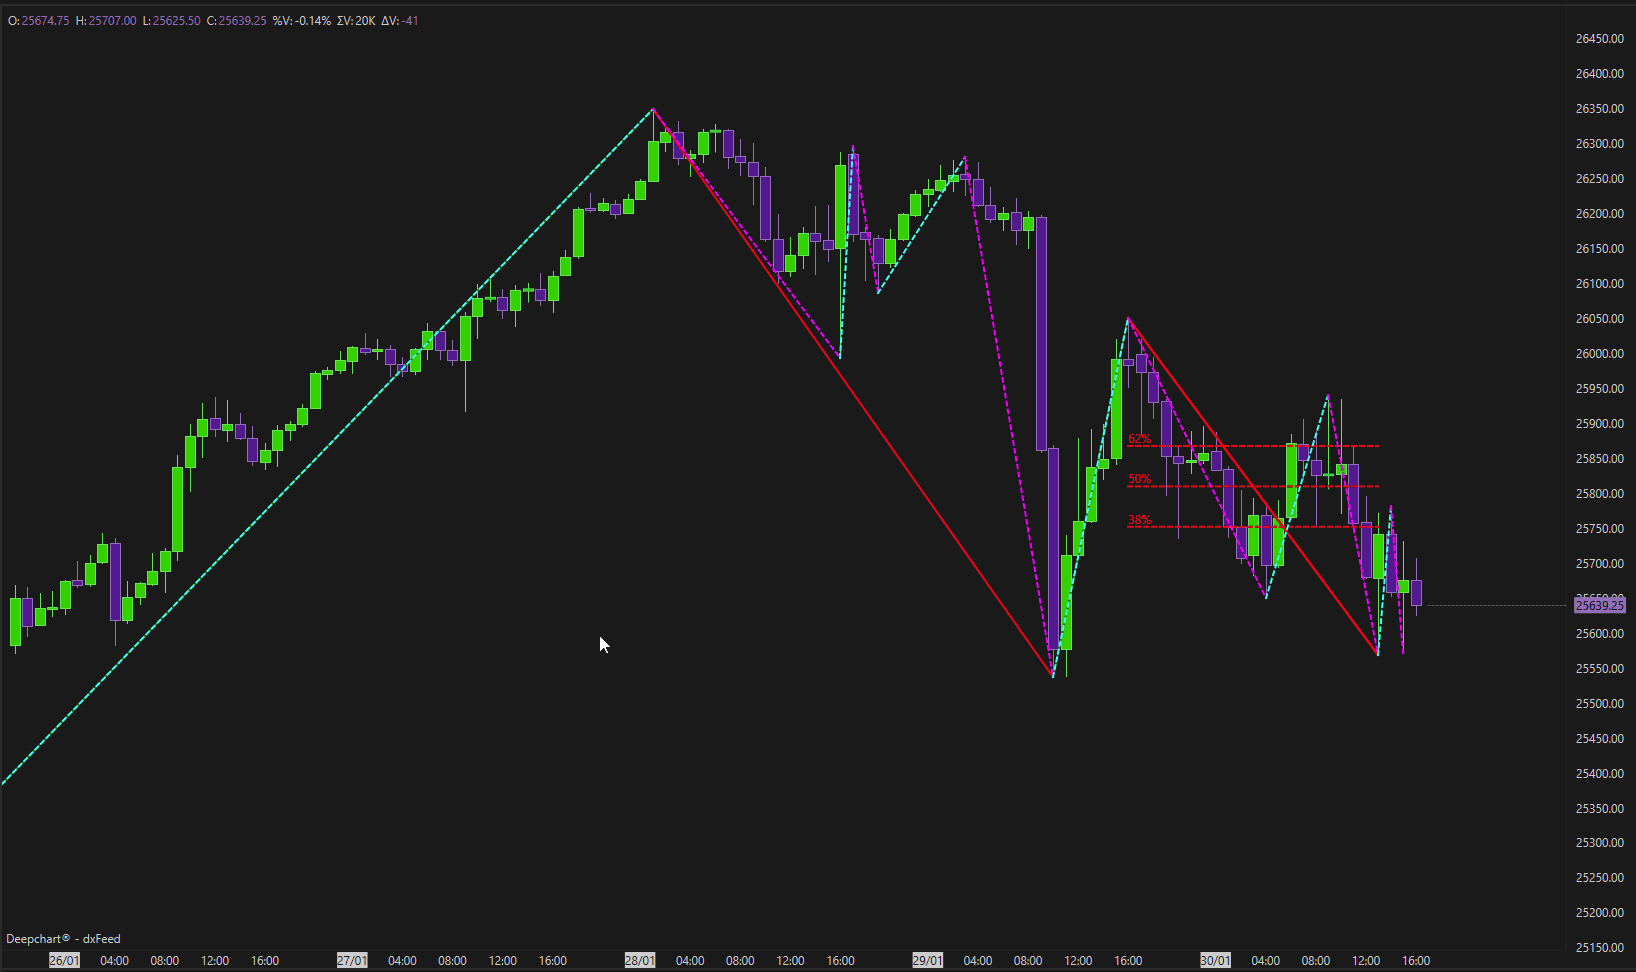
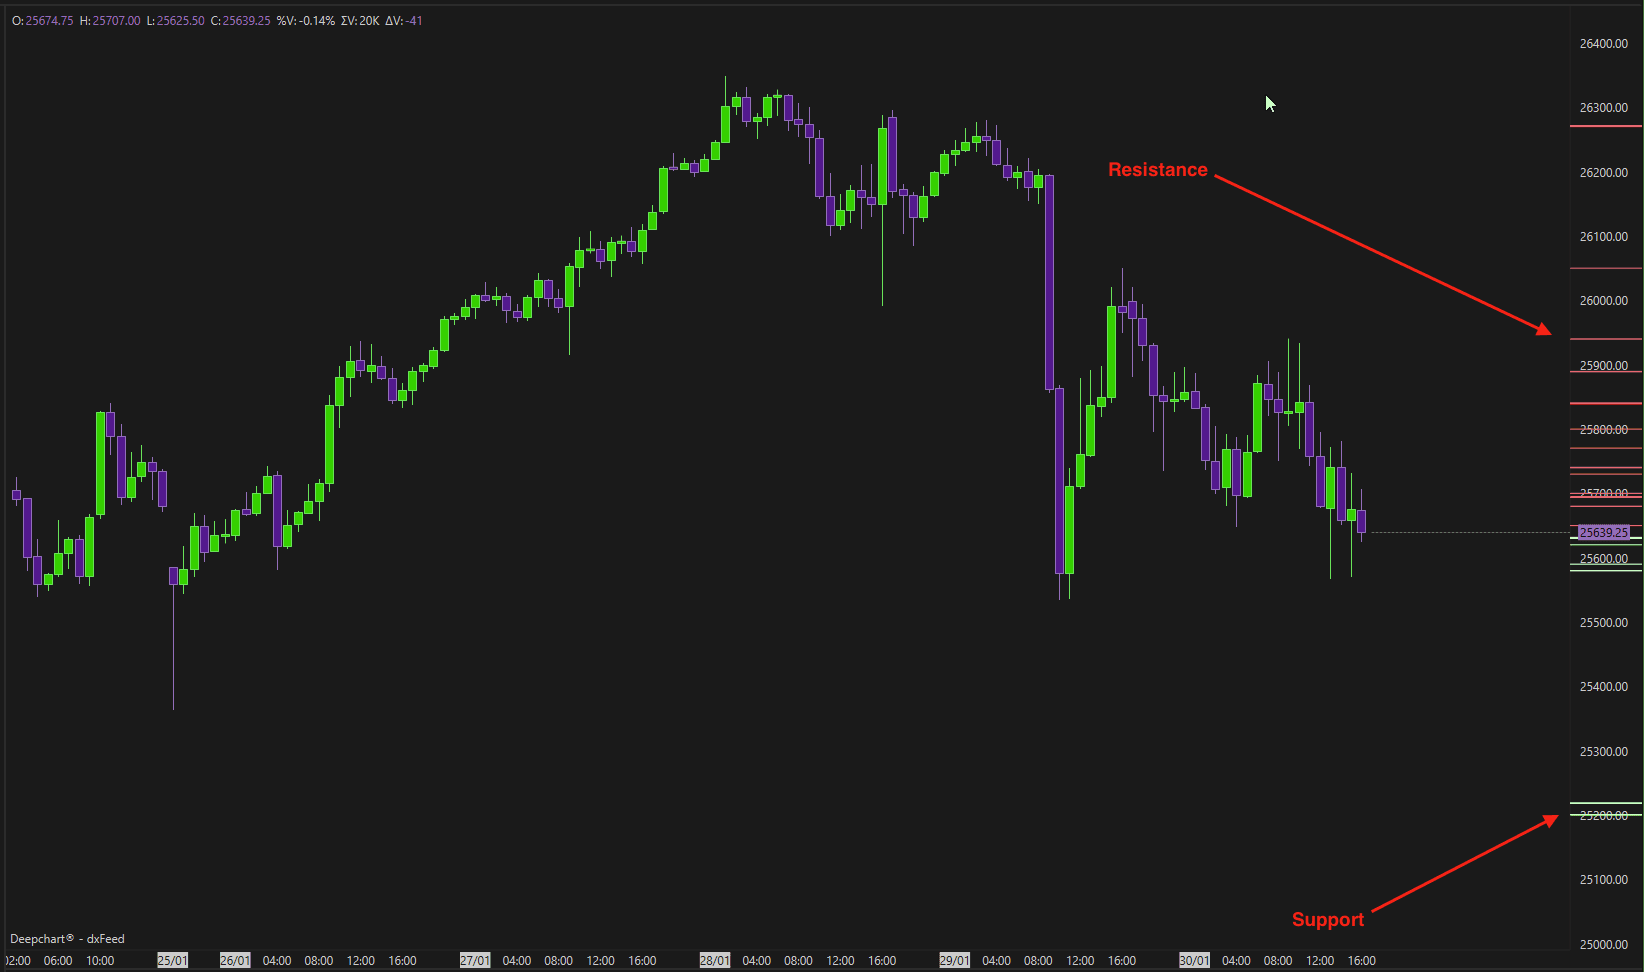
Example Explanation
In the example shown:
Only Zig Zag swings are enabled
Confluences are calculated using price action only
The gray vertical line marks the calculation start
Start date is determined using 9 swings with 3% reversal
Confluence swings use a 1% reversal
Zones are highlighted when at least 3 swings align within 5 ticks
Green zones represent resistance, red zones represent support.
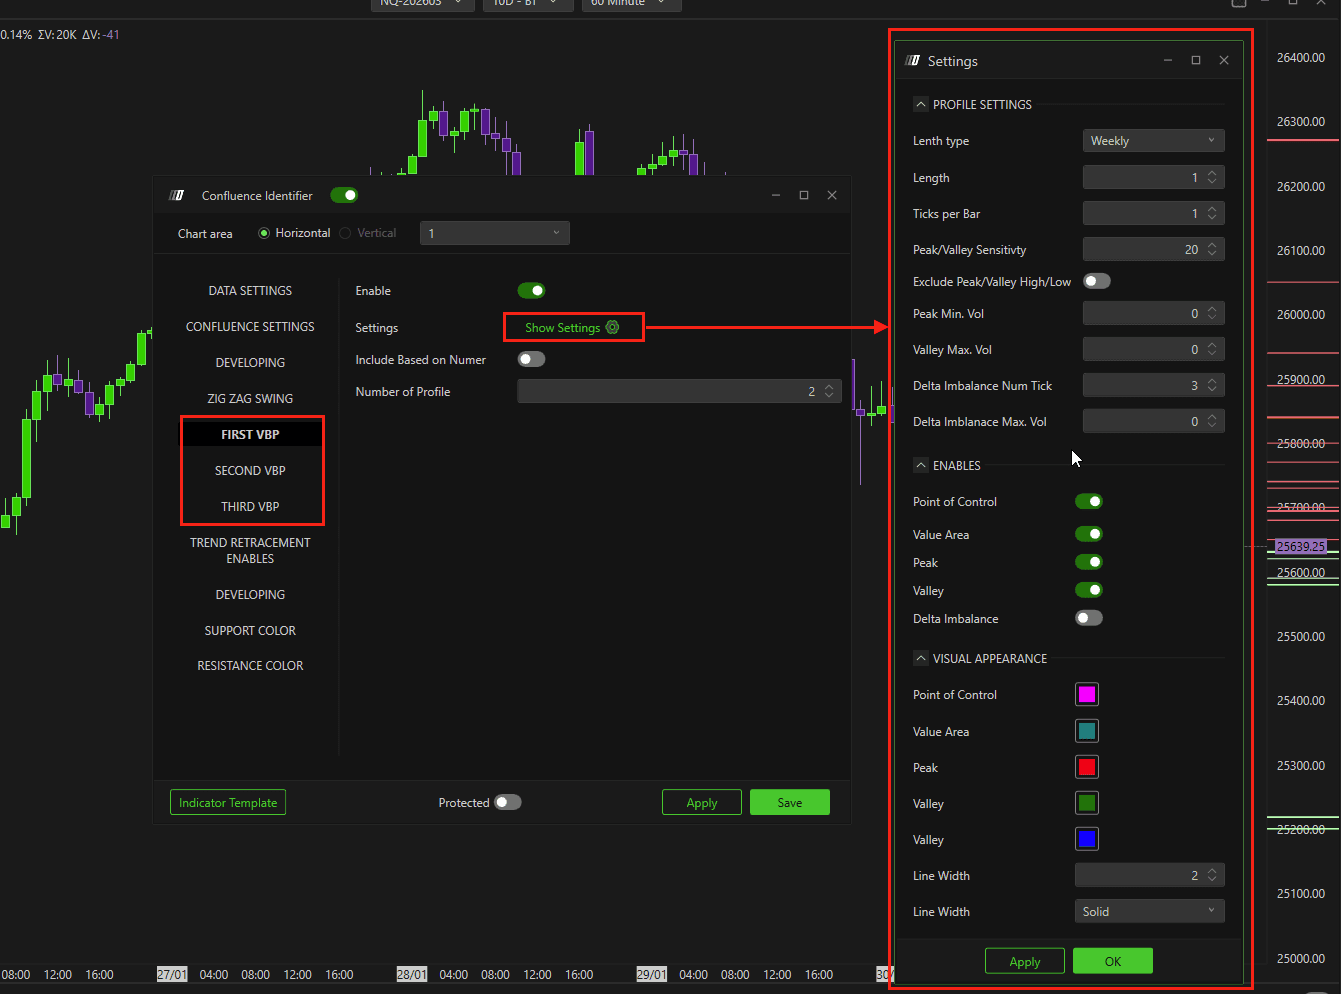
First / Second / Third Volume By Price (VBP)
You can enable up to three separate Volume By Price profiles.
Enable
Activates the selected Volume Profile.
Profile Settings
Allows configuration of:
Profile type: Daily, Weekly, Monthly, Composite
Tick grouping
Minimum volume for Peaks
Maximum volume for Valleys
Additional profile-specific options
Enablements
Choose which VBP elements participate in confluence calculations:
Point of Control (POC)
Value Area
Peaks
Valleys
Delta Imbalances
Visual Appearance
Customize:
Colors
Line thickness
Line style
Include by Number
Enabled: Only a fixed number of recent profiles are considered
Disabled: All profiles from the calculation start date are used
Number of Profiles
Defines how many profiles are included when the option above is enabled.
Trend Retracement Enables
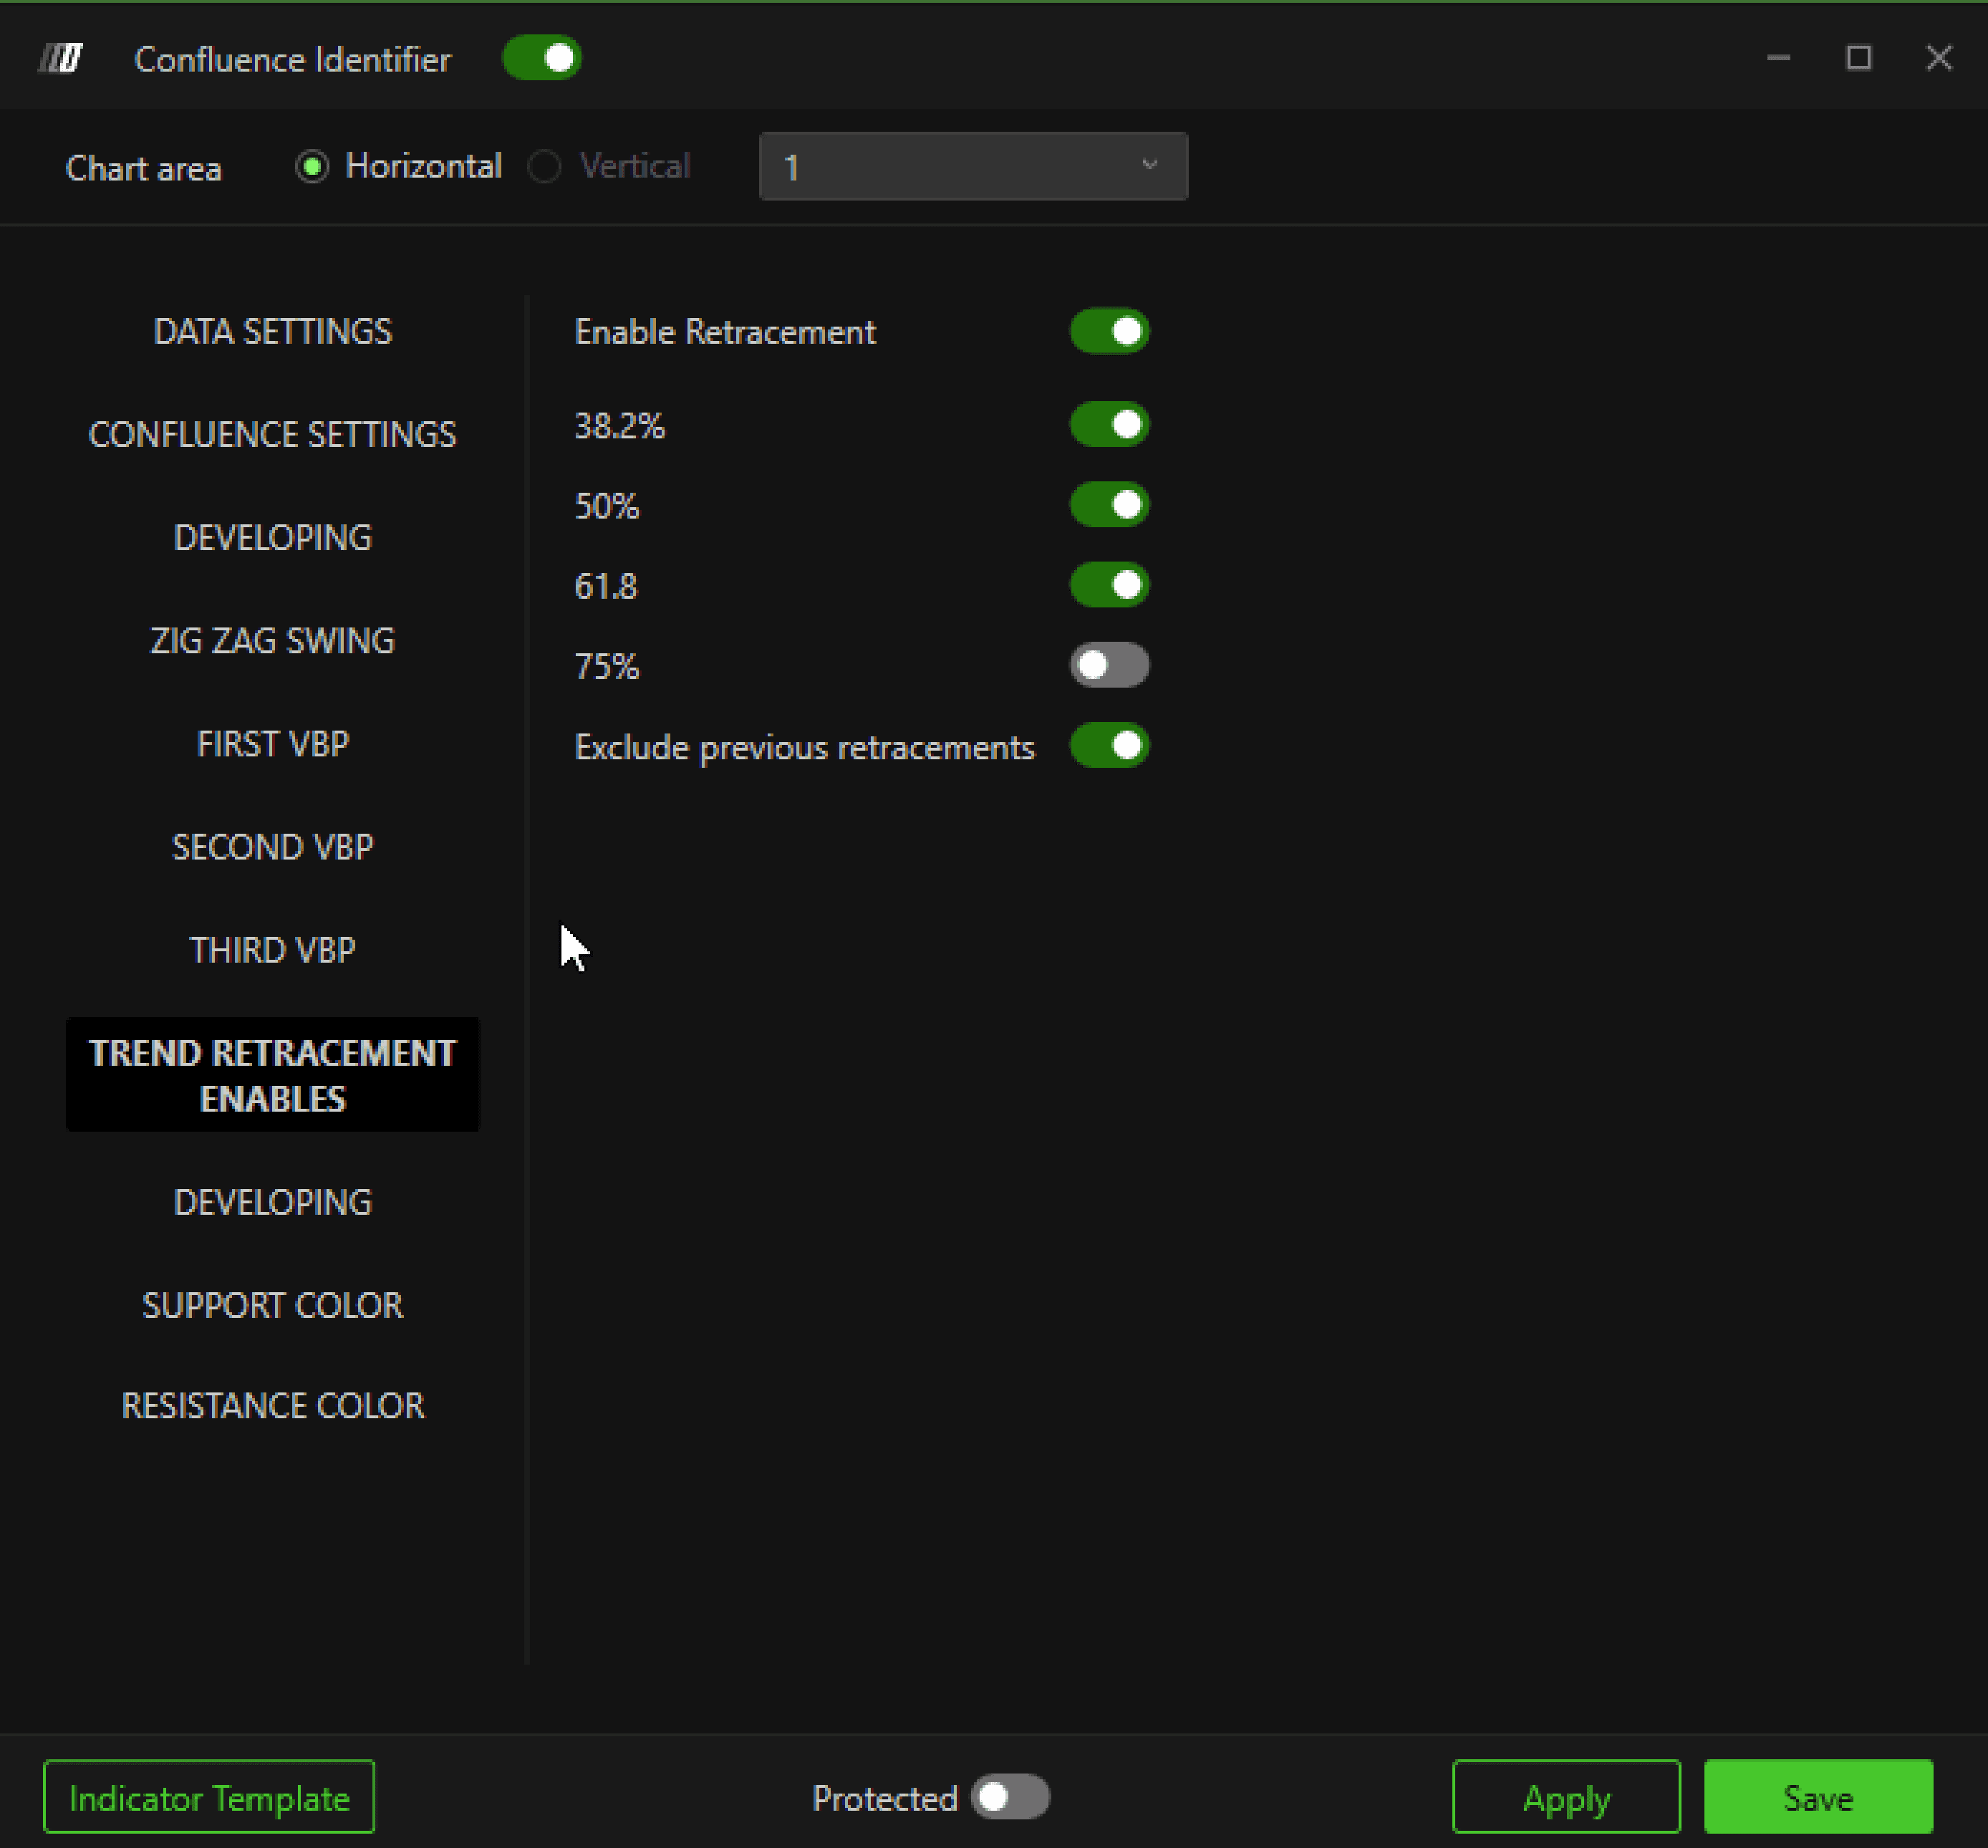
Enable Retracements
Adds retracement levels from the main swing to confluence calculations:
38.2%
50%
61.8%
75%
Exclude Previous Retracements
Enabled: Only the most recent swing retracements are used
Disabled: Previous retracements are also included
Developing Settings
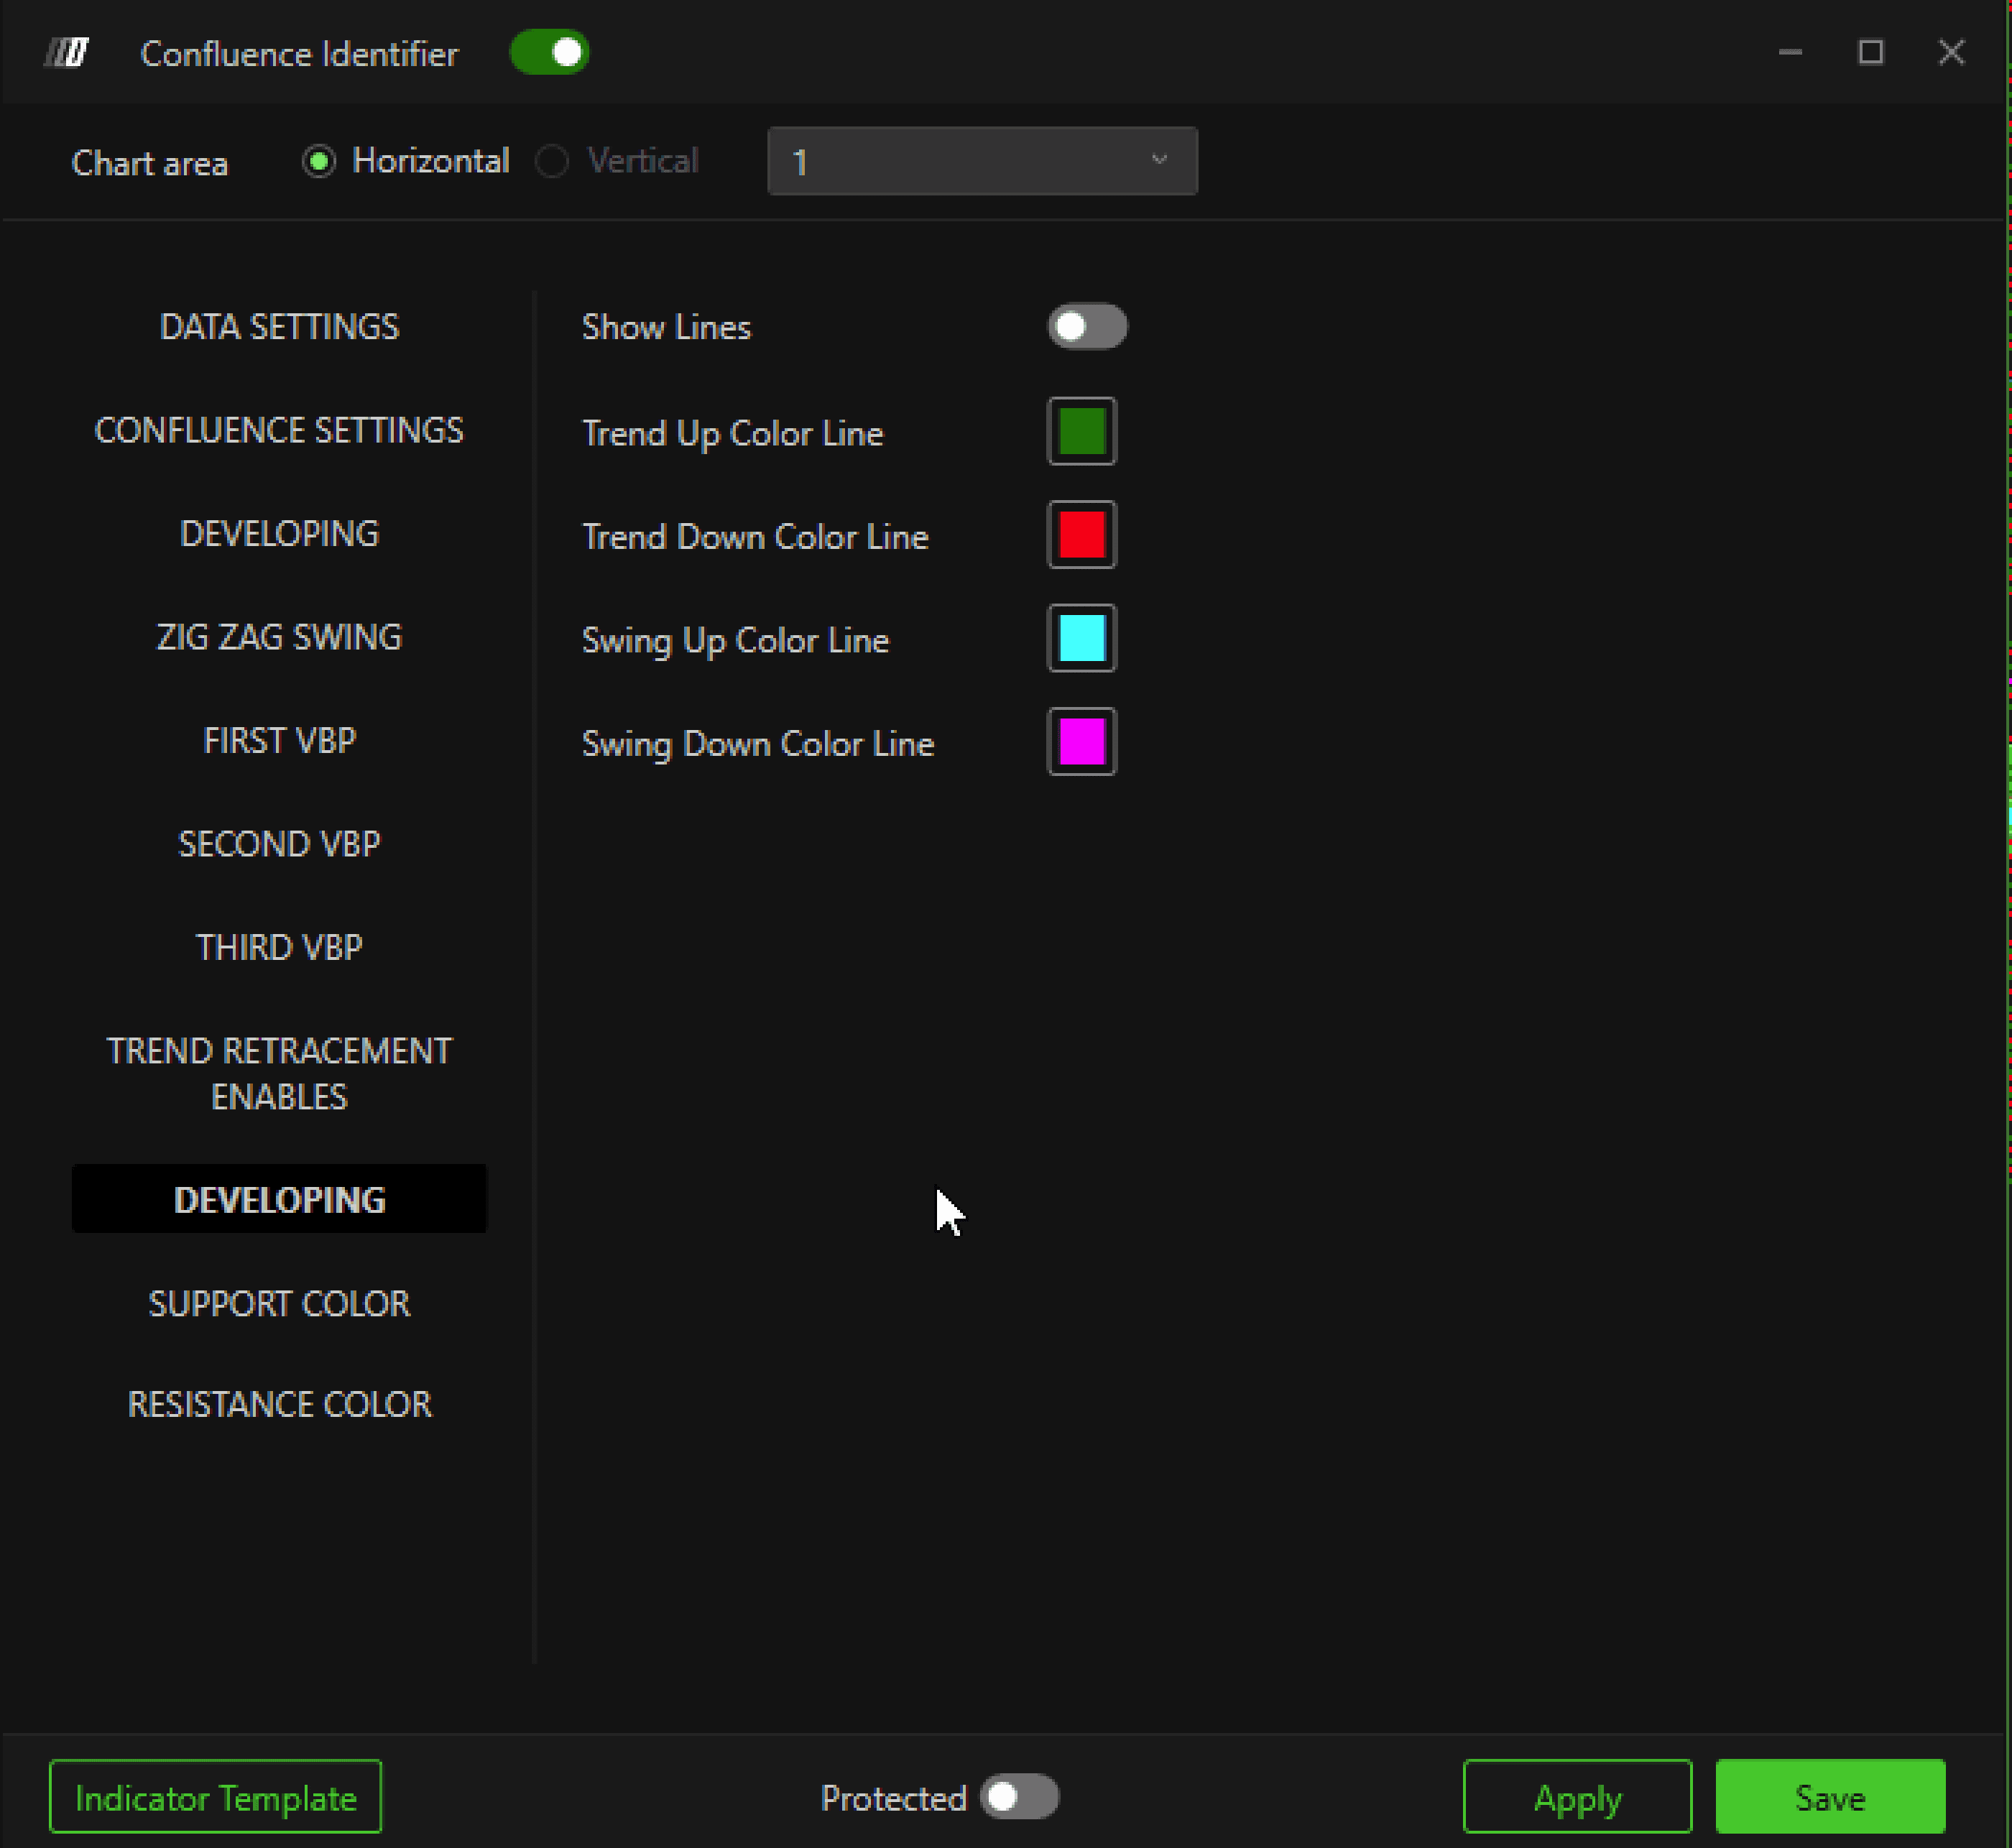
Allows you to:
Display Zig Zag lines
Customize colors for bullish and bearish swings
This helps visually distinguish market structure directly on the chart.
Support & Resistance Colors
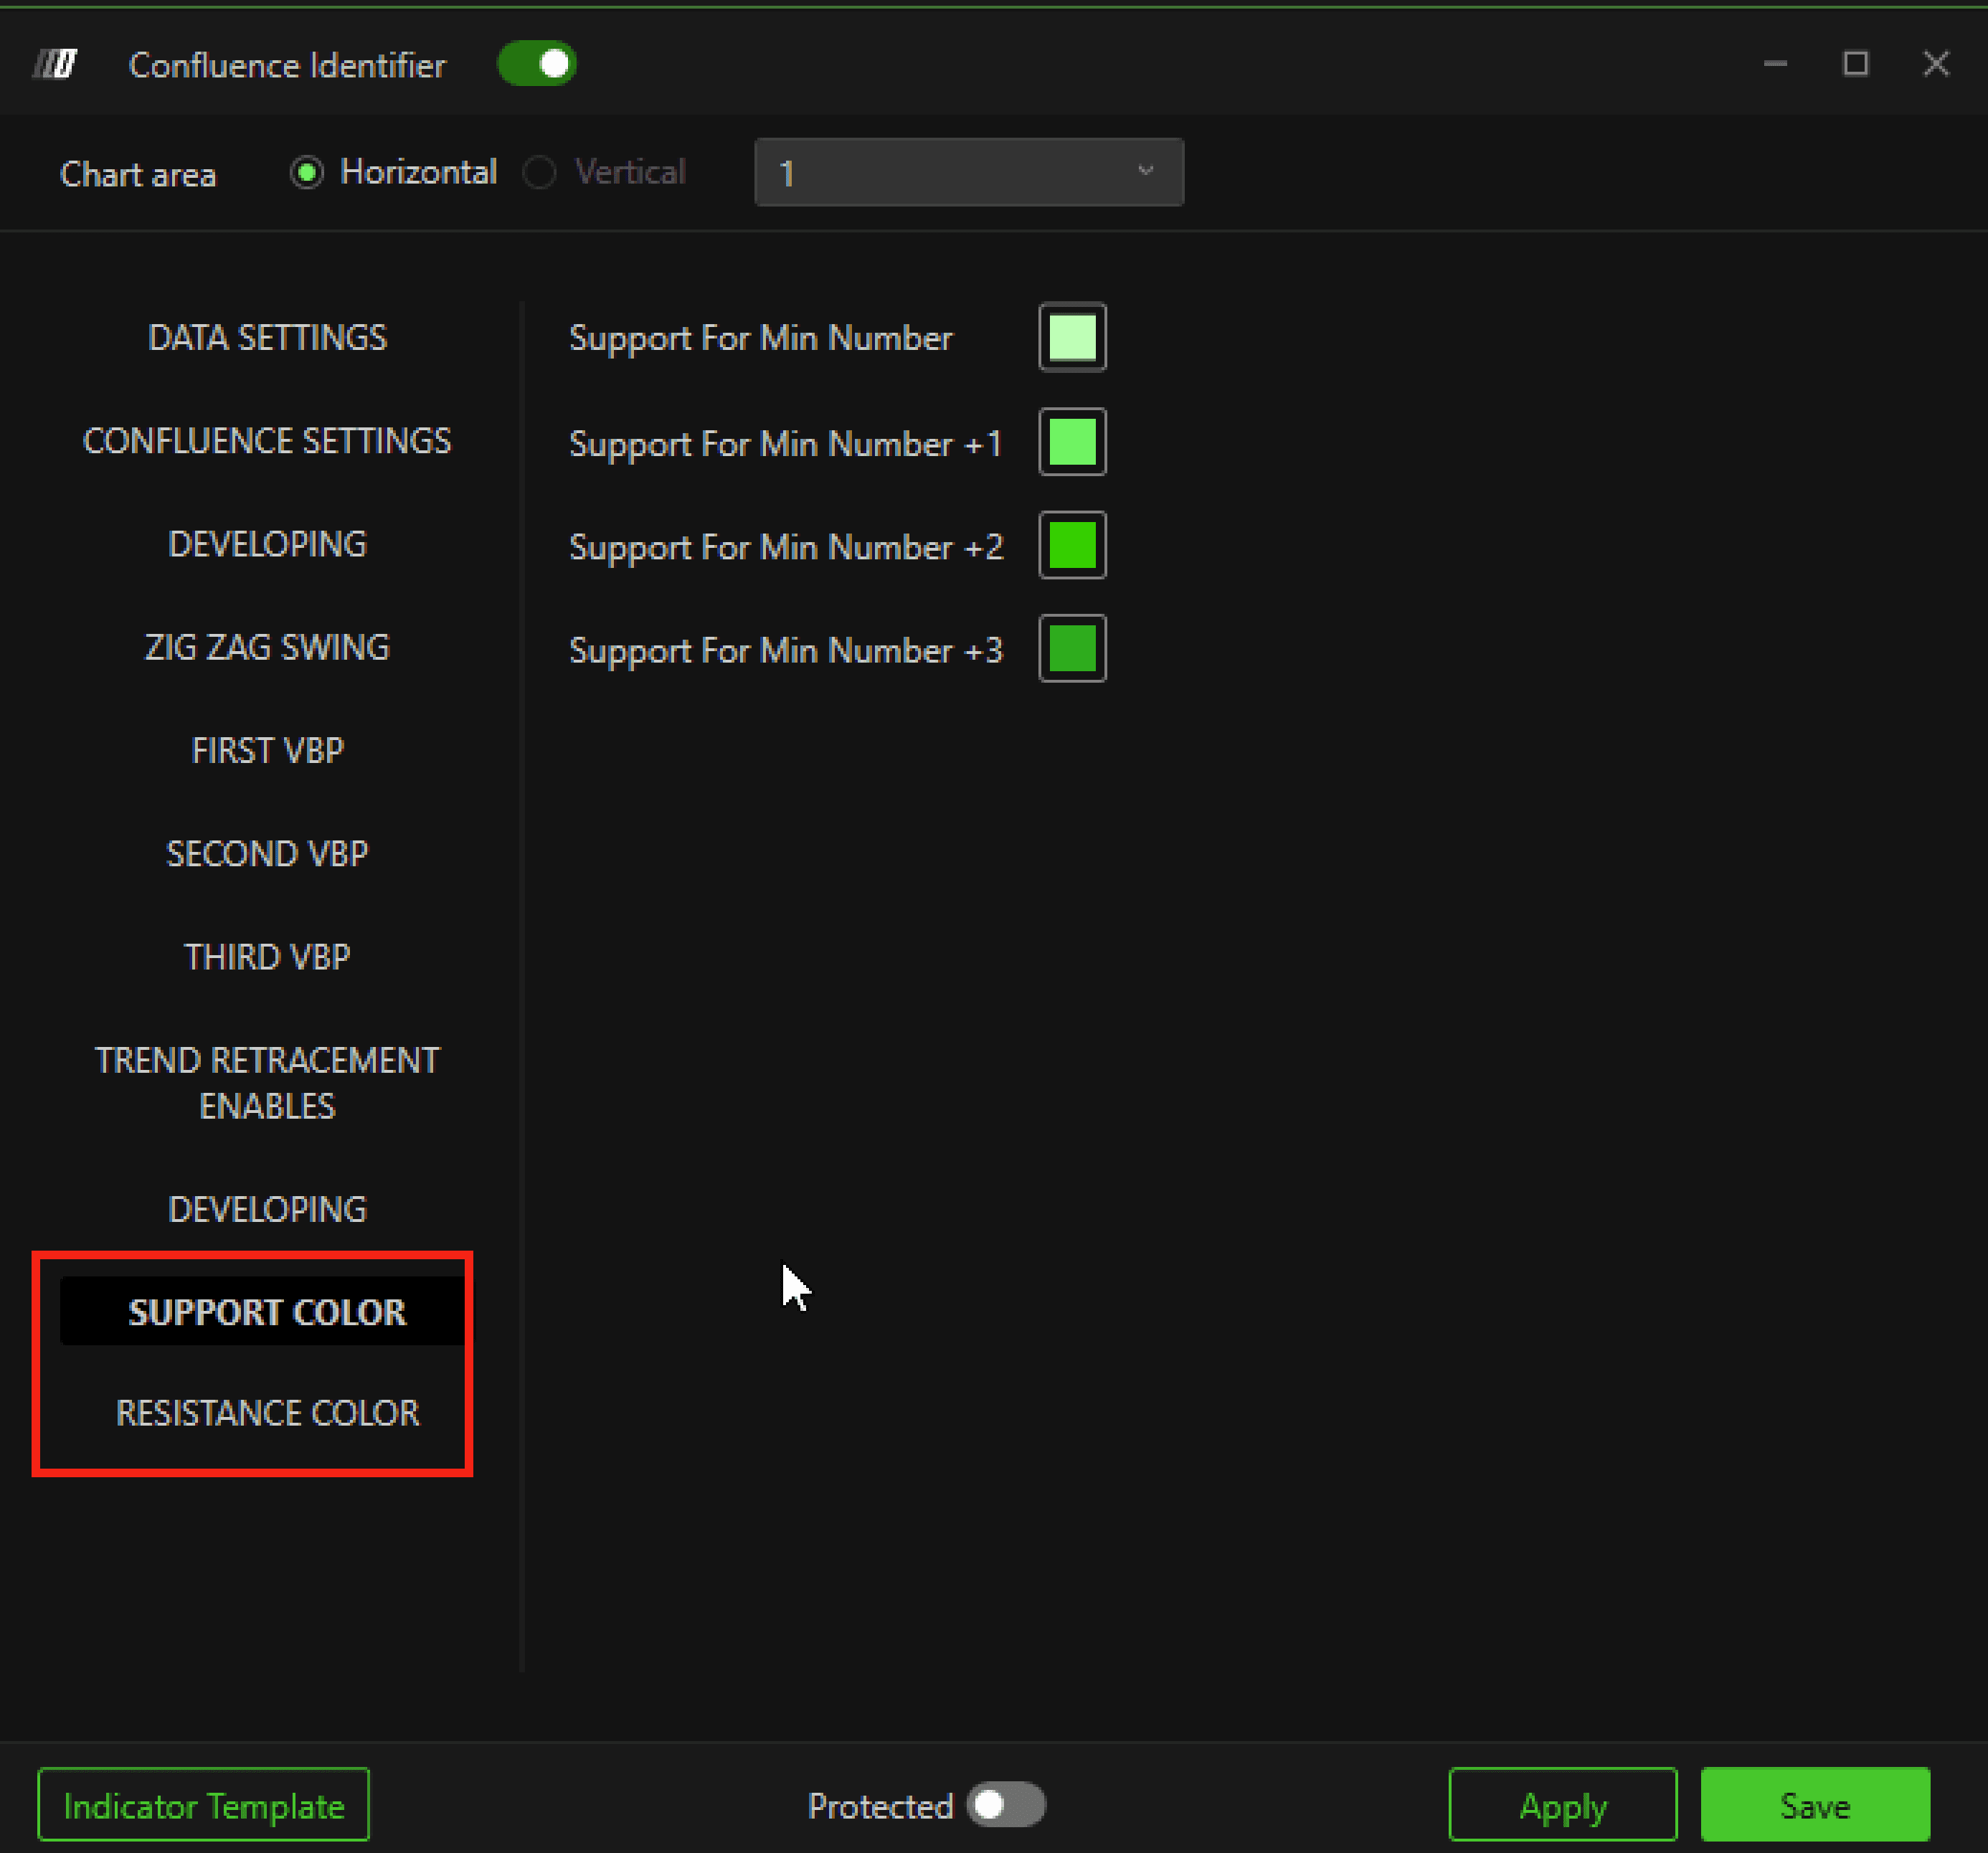
Customize the colors of support and resistance zones based on the number of confluences forming each zone.
Stronger zones (more confluences) can be visually emphasized.
Best Practices & Notes
As more elements are enabled (multiple VBPs, swings, retracements), it is recommended to:
Increase the minimum number of confluences
Reduce sensitivity ticks
This ensures only the most significant price zones are highlighted.
In the example shown:
Three Volume Profiles (Daily, Weekly, Composite)
Price swings
Last swing retracements
Minimum 5 confluences
Sensitivity of 3 ticks
For a cleaner chart, you can disable VBP lines and display Volume Profiles using separate indicators.