Indicators
Updated:
The Unfinished Auction indicator highlights areas on the chart where the market has unfinished business — meaning the auction process did not complete properly.
To understand this concept, it’s important to first distinguish between a Finished Auction and an Unfinished Auction.
Finished Auction
A finished auction occurs when price reaches a high or low where there is presence of both aggressive buyers and aggressive sellers — indicating that both sides participated in the auction at that level.
This suggests that the market successfully completed its exploration in that direction.

Unfinished Auction
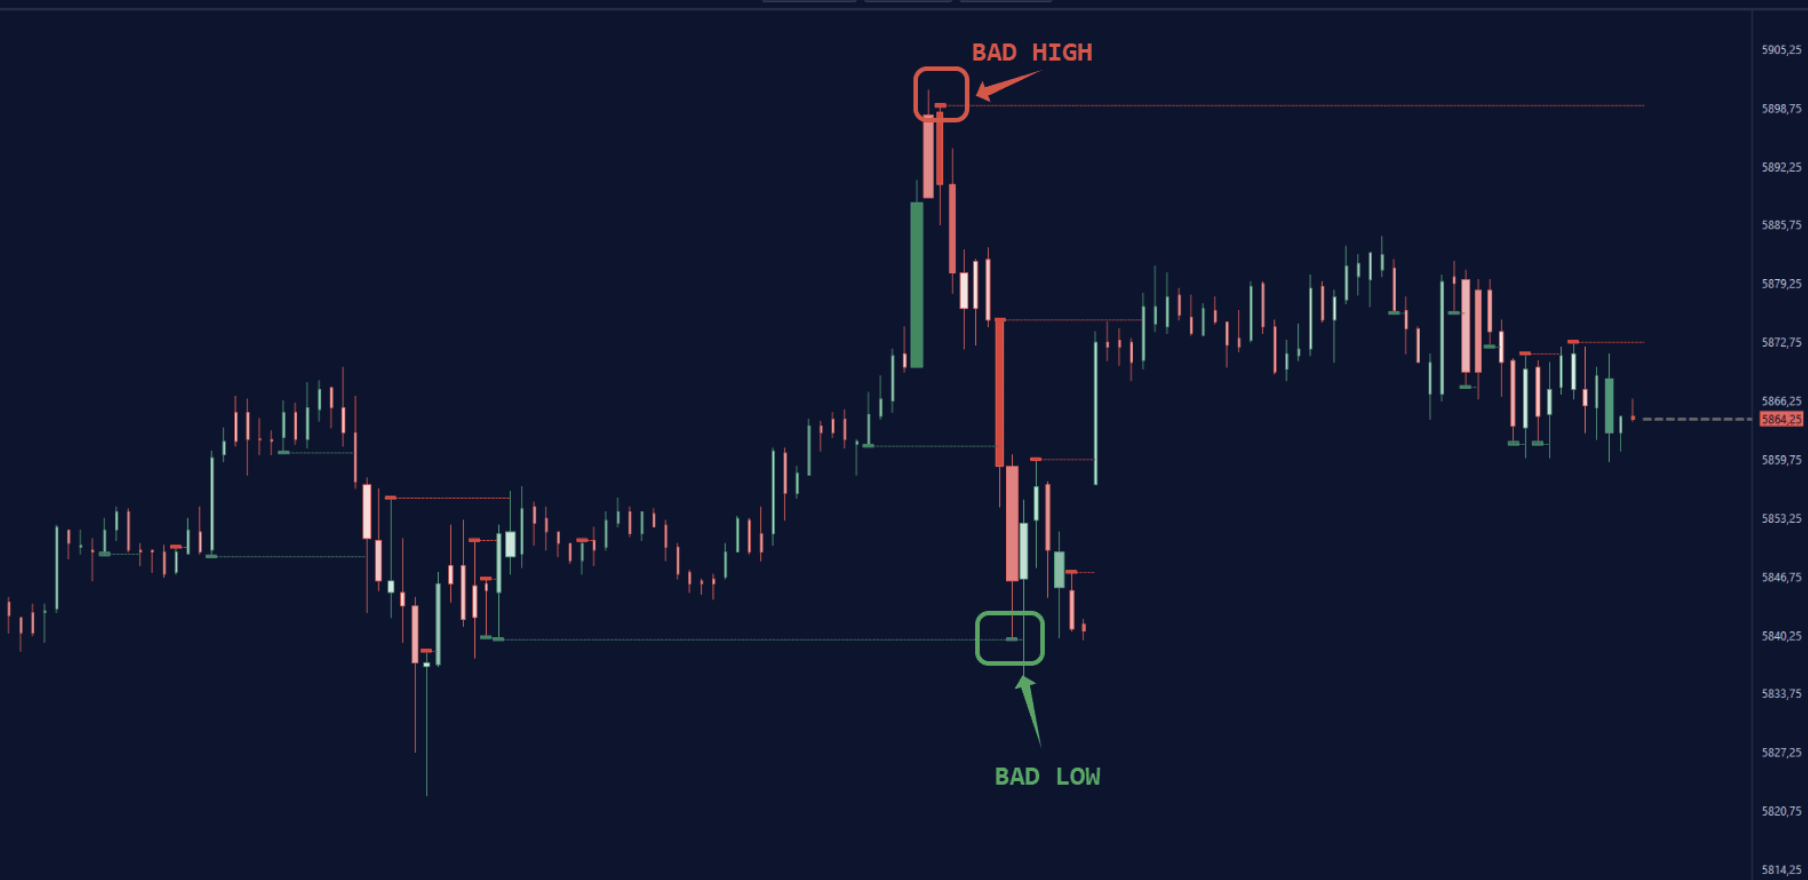
An unfinished auction, on the other hand, occurs when the market reaches a high or low without the presence of the opposite side’s aggression.
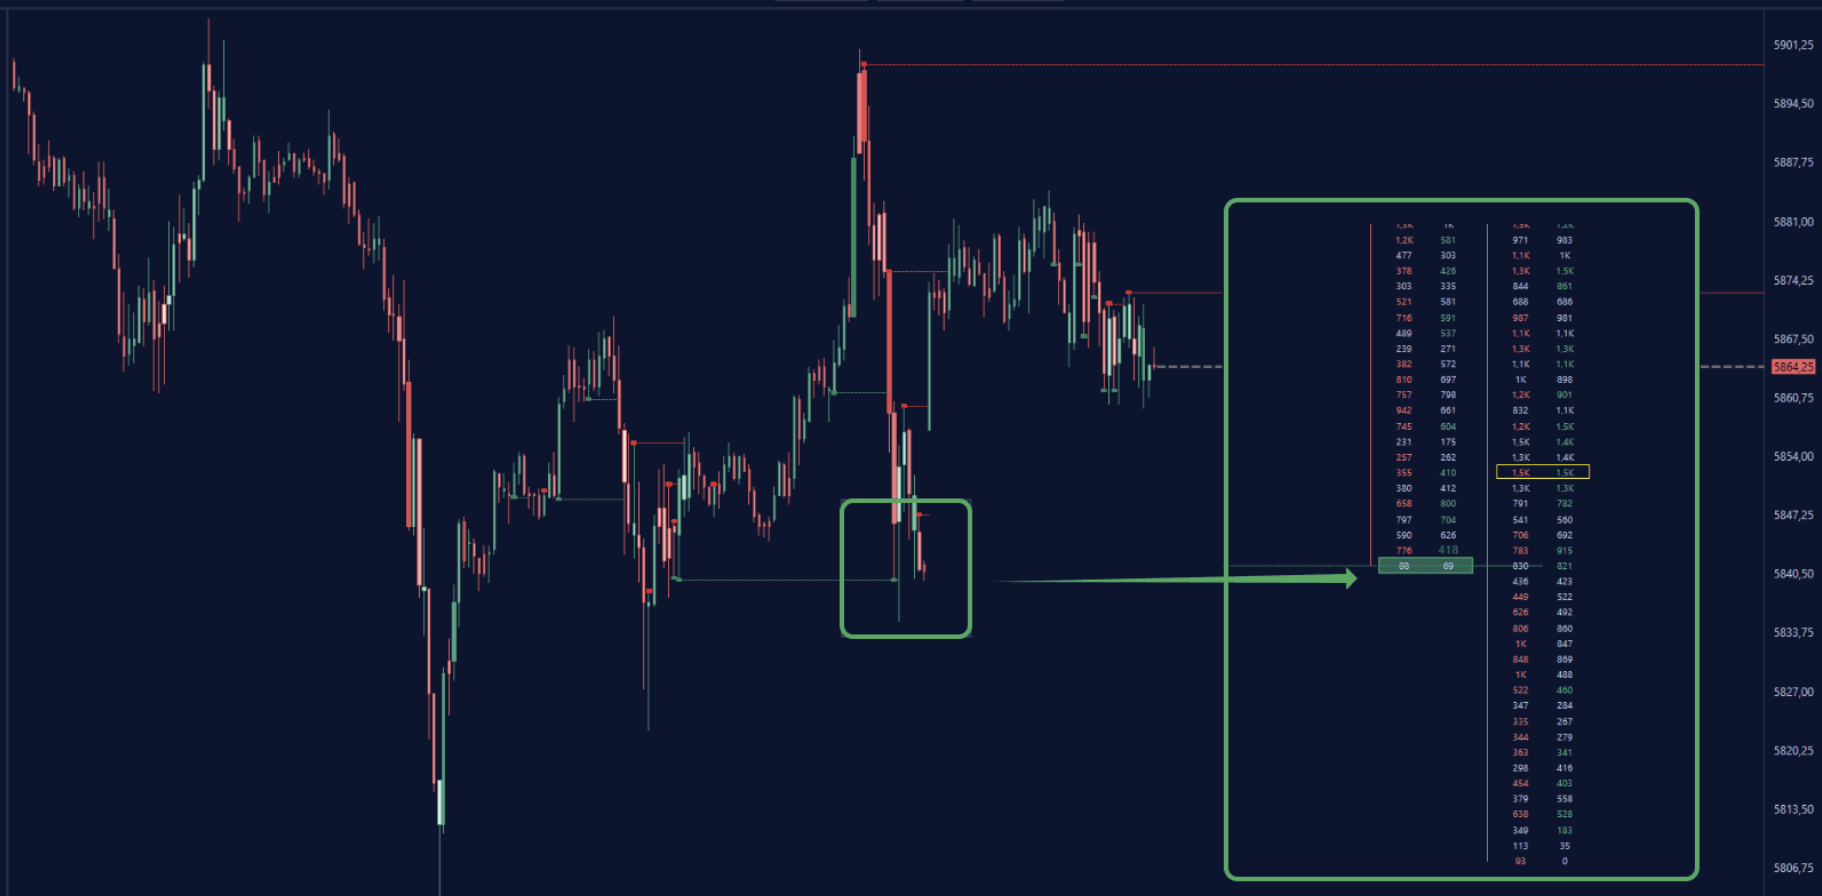
In the example below, the high shows 60 aggressive sellers, but zero aggressive buyers above that level — indicating an unfinished auction.
Such levels often act as magnets for price, as the market may revisit them later to “finish the business” left incomplete.
The Unfinished Auction indicator from DeepChart allows us to highlight "anomalies" in the trading auction. In fact, normally in the high tick of a candle we will find a 0 in Bid and x contracts traded in Ask while in the low tick we will find x contracts traded in Bid and 0 in Ask, when this is not the case, that is, when there are contracts traded on the high tick in Bid or the low tick in Ask, the indicator will show a rectangle.
Settings
Clicking on the indicator settings icon will open its configuration window, within which you can make several choices regarding the functionality of the indicator itself.
General
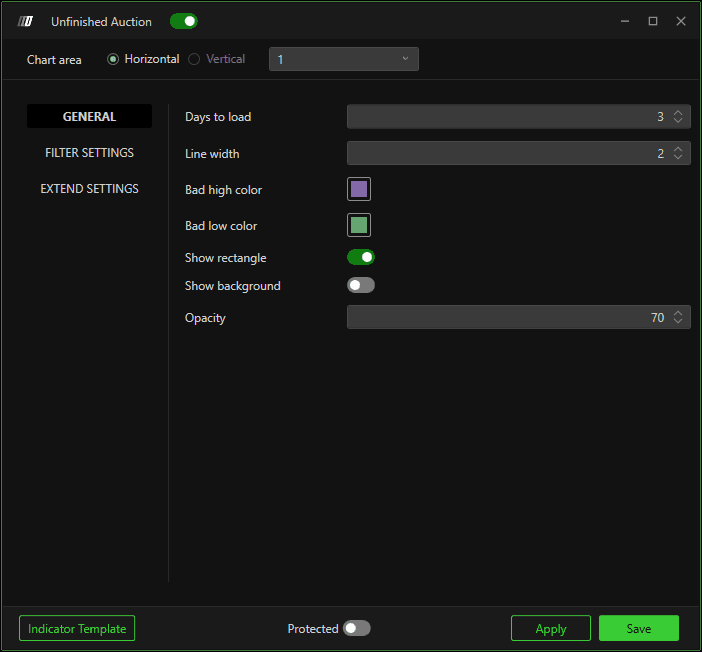
Days to Load
Defines the number of days for which you want to load the indicator.
Line Width
Defines the thickness of the dividing line of the rectangle plotted by the indicator.
Color Bad High / Bad Low
Defines the color of the rectangle, allowing you to differentiate between Bad High and Low.
Show rectangle
Defines whether or not to show the rectangle, as some users may prefer to display only the extension lines leaving the candle devoid of any graphical markings.
Show background
Show rectangle background.
Opacity
Defines the opacity of the background.
Filter Settings

If placed on manual it allows to apply a filter on the minimum volume, useful to highlight only the most relevant Bad High/Low, which are more likely to be taken up by the market.
Extend Settings
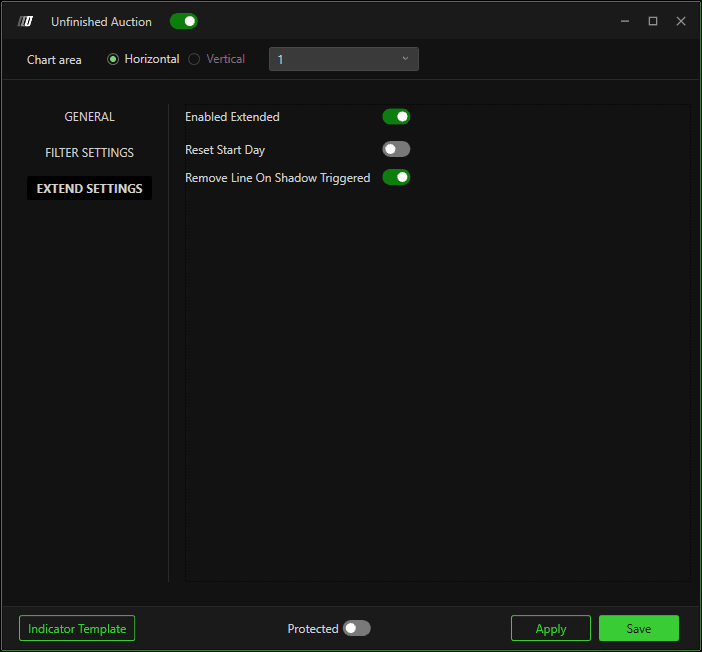
Lets you extend lines from the Bad High/Low, decide whether to reset them every start of the day and whether to stop them at the intersection with the shadow of a next candle.
Use Case Example