Updated:
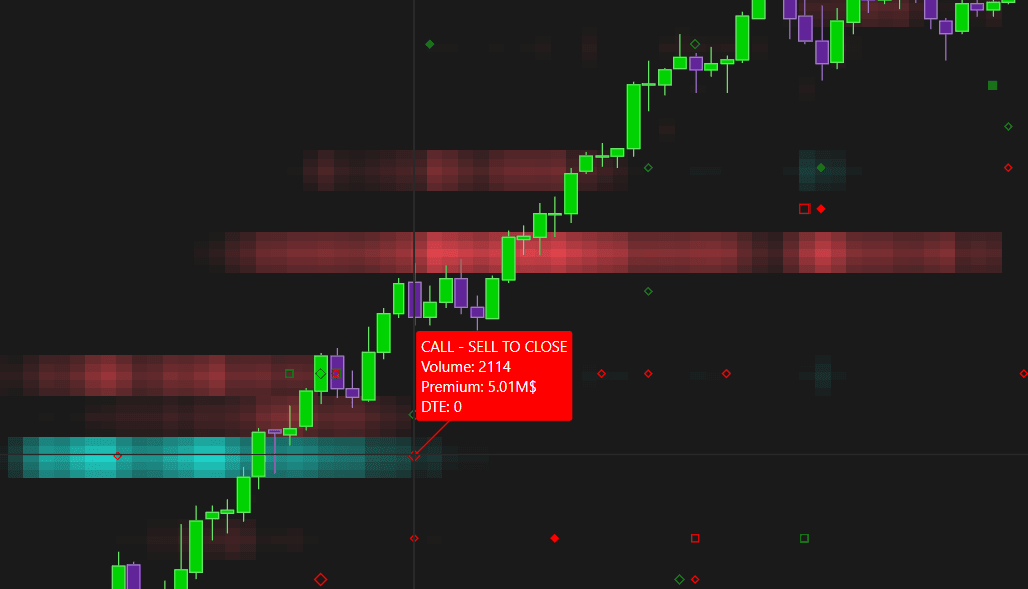
Option Big Flows works similarly to Big Trades but for the options market. It plots markers on your chart whenever a large premium trade is executed, helping you identify when significant institutional or professional money is entering or exiting the market through options. Each marker tells you whether the flow was on the call or put side, whether it was a buy or sell, and whether the position was opened or closed.
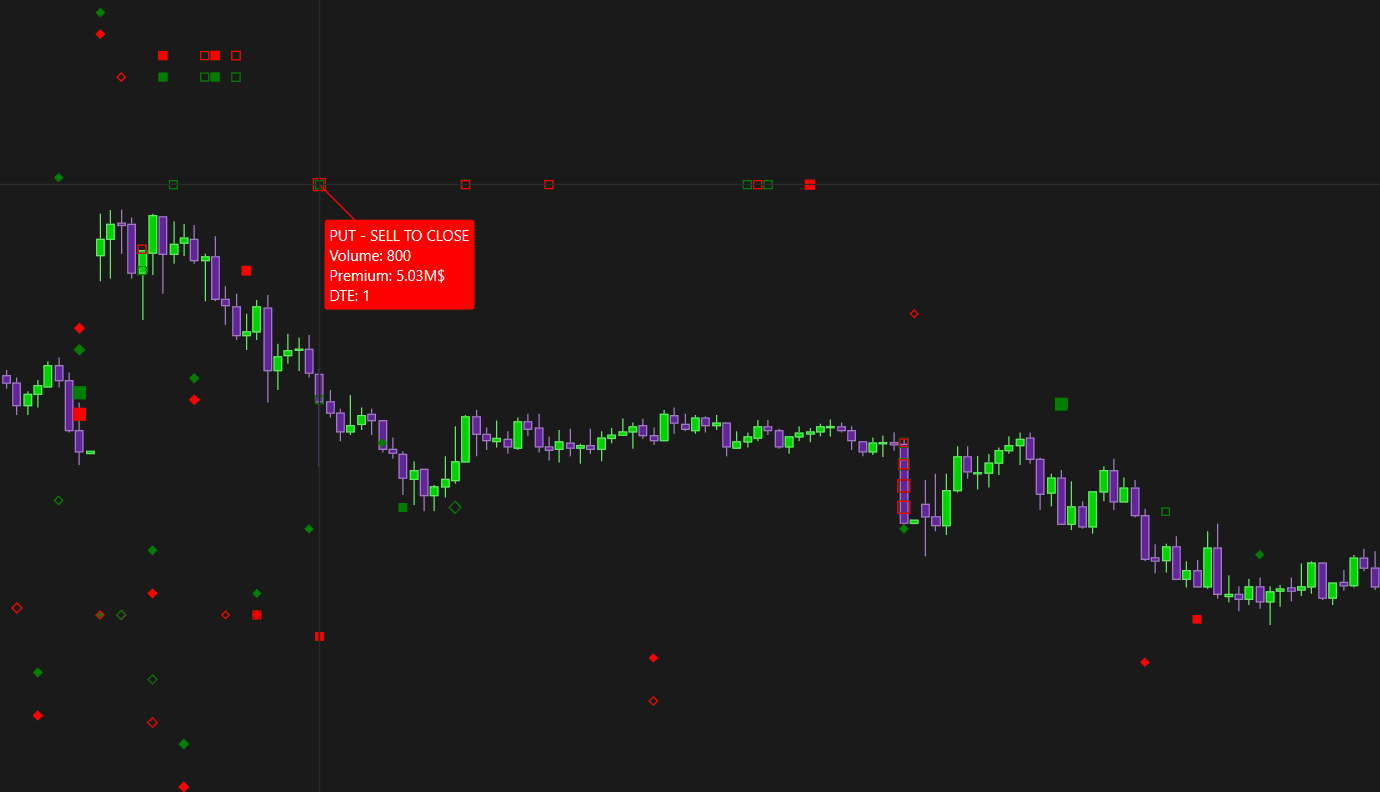
Note: Option Big Flows is available on SPX only, as it requires real CBOE participant data.

How to Add Option Big Flows
Go to New in the top menu
Click on Option Chart
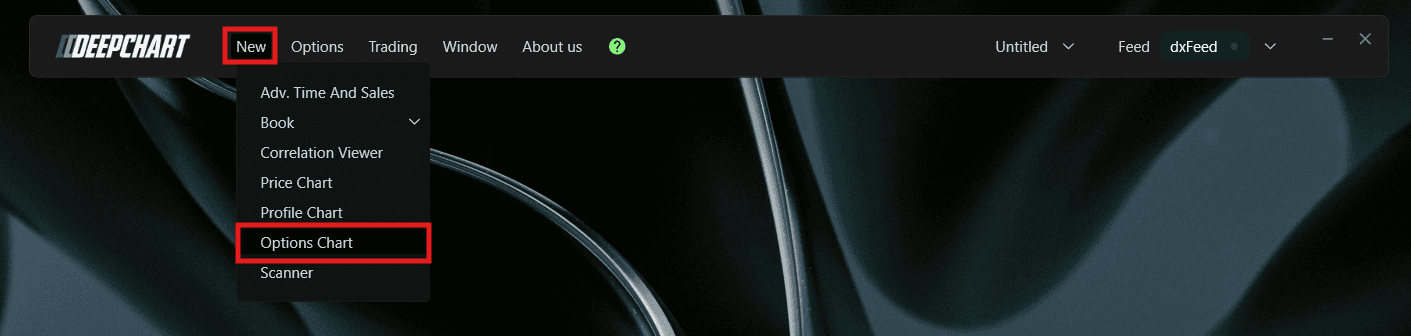
A Select Instrument dialog will appear. Since Option Big Flows requires CBOE data, select SPX - Symbol: ES-CME, Exchange: CME
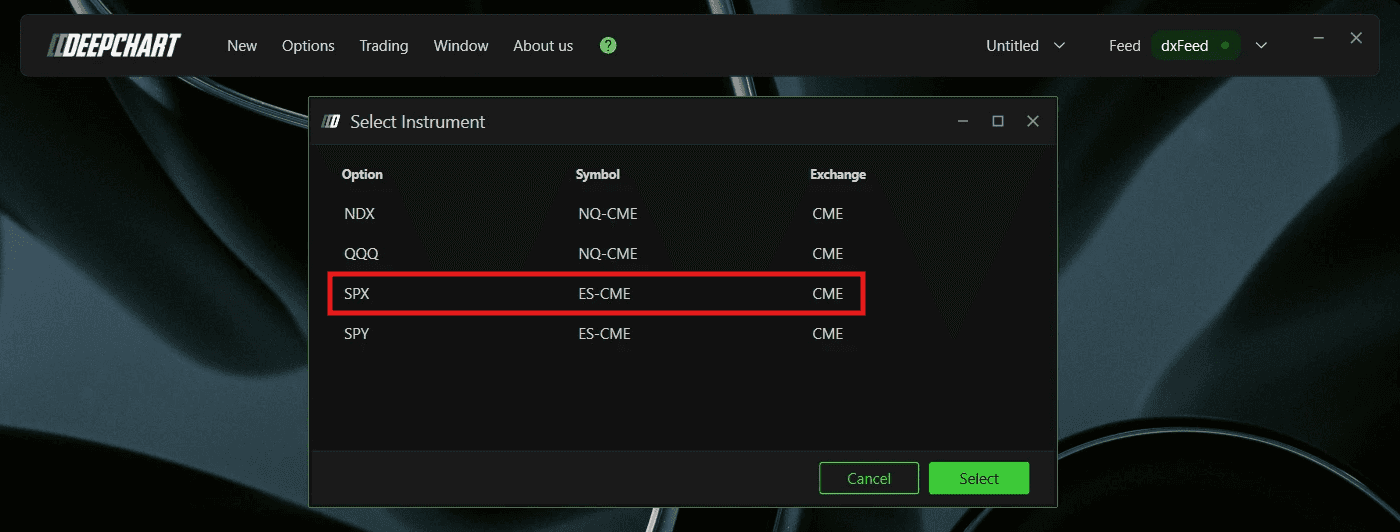
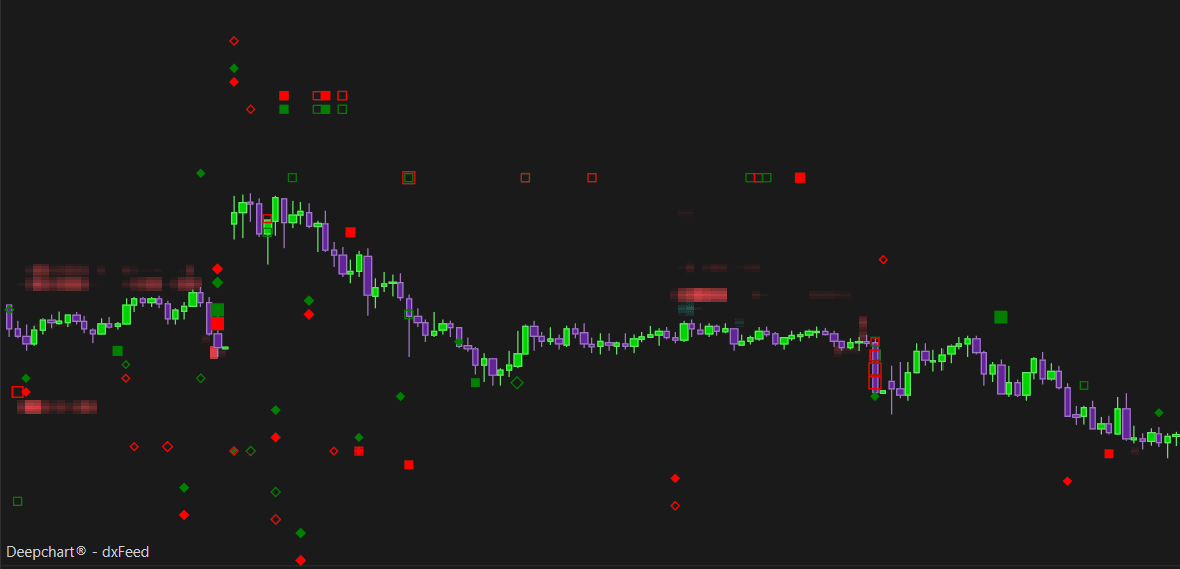
Click to open the chart
Once the Option Chart is loaded, click the Indicator Add button on the chart toolbar
Search for Option Big Flows and click + to add it
Click the settings icon to open the configuration window

Understanding the Markers
Option Big Flows uses two marker shapes to distinguish between calls and puts:
Diamond - Call side flow
Square - Put side flow
Each marker also tells you whether the position was opened or closed:
Filled marker - Position opened
Hollow marker - Position closed
And the color tells you the direction:
Green - Buy
Red - Sell
Understanding Key Terms
Before reading the markers, it helps to understand a few core options concepts:
Call - An option that gives the buyer the right to buy the underlying at a set price. Traders buy calls when they expect price to go up
Put - An option that gives the buyer the right to sell the underlying at a set price. Traders buy puts when they expect price to go down
Premium - The total dollar value paid for the option contract, calculated as the contract price multiplied by volume. This is what the Min. Premium filter uses to decide which flows are large enough to plot
Open - The trade is establishing a brand new options position
Close - The trade is exiting or reducing an existing options position
DTE (Days to Expiration) - The number of days remaining before the option contract expires. A DTE of 0 means the option expires the same day
Each combination of call/put and buy/sell carries a different market bias:
Buying a call - a bullish trade, betting price will rise
Selling a call - a bearish trade, betting price will stay below the strike
Buying a put - a bearish trade, betting price will fall
Selling a put - a bullish trade, betting price will stay above the strike
Keep this in mind when reading the markers, since a buy is not always bullish. Buying a call is bullish, but buying a put is bearish, even though both are technically a “buy.”
Settings
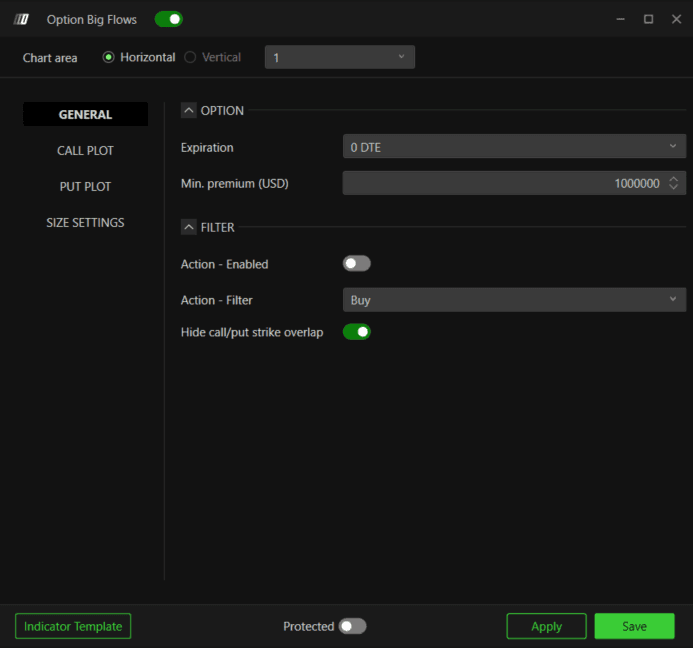
General
Option
Expiration - Filter flows by expiration. Options available: 0 DTE, <= 1d, <= 2d, <= 3d, <= 4d, <= 5d, <= 6d, <= 7d, <= 31d, <= 91d, All expirations. Default is 0 DTE
Min. Premium (USD) - Set the minimum premium threshold in USD. Only flows exceeding this amount will be plotted. Default is $1,000,000
Filter
Action - Enabled - Enable this toggle to filter flows by action type (Buy or Sell)
Action - Filter - Choose between Buy or Sell when the Action filter is enabled
Hide call/put strike overlap - When enabled, this hides trades where both a call and a put are executed at the same strike simultaneously. These are typically offsetting strategies where the net directional exposure is neutral. Disable this if you want to see all flows regardless. Default is enabled
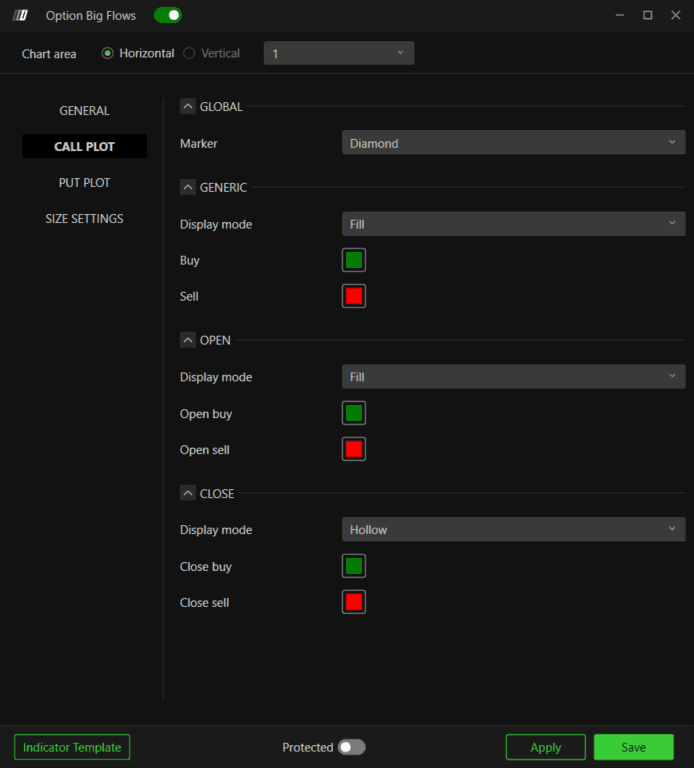
Call Plot
Global
Marker - Choose the marker shape for call flows. Options: Circle, Square, Diamond, Text. Default is Diamond
Generic
Display mode - Choose between Fill or Hollow for generic call markers
Buy - Color for buy call flow. Default is green
Sell - Color for sell call flow. Default is red
Open
Display mode - Choose between Fill or Hollow for open position markers. Default is Fill
Open buy - Color for call open buy. Default is green
Open sell - Color for call open sell. Default is red
Close
Display mode - Choose between Fill or Hollow for close position markers. Default is Hollow
Close buy - Color for call close buy. Default is green
Close sell - Color for call close sell. Default is red
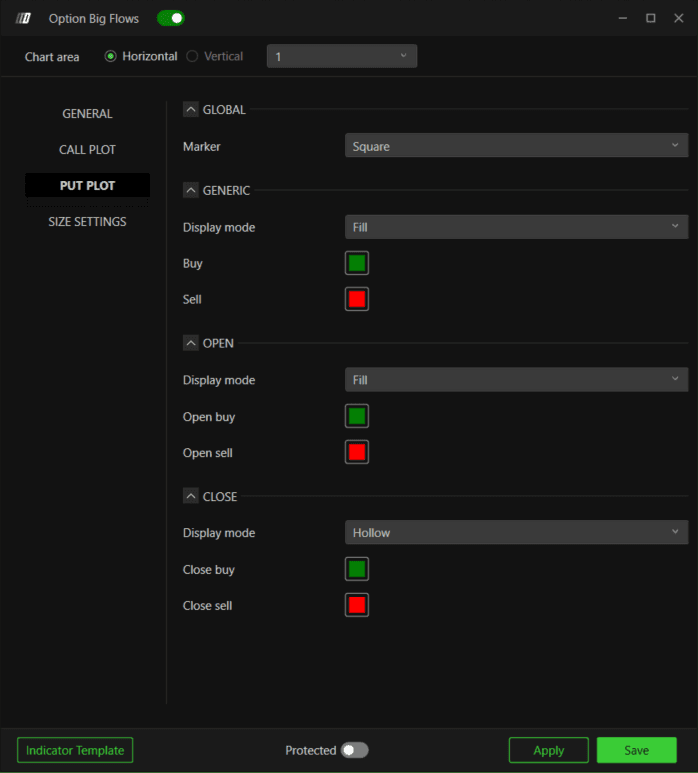
Put Plot
Global
Marker - Choose the marker shape for put flows. Options: Circle, Square, Diamond, Text. Default is Square
Generic
Display mode - Choose between Fill or Hollow for generic put markers
Buy - Color for buy put flow. Default is green
Sell - Color for sell put flow. Default is red
Open
Display mode - Choose between Fill or Hollow for open position markers. Default is Fill
Open buy - Color for put open buy. Default is green
Open sell - Color for put open sell. Default is red
Close
Display mode - Choose between Fill or Hollow for close position markers. Default is Hollow
Close buy - Color for put close buy. Default is green
Close sell - Color for put close sell. Default is red
Tip: By default, green means Buy and red means Sell, same as the Call Plot. This is the literal action, not market sentiment.
A bought call is bullish and shows green
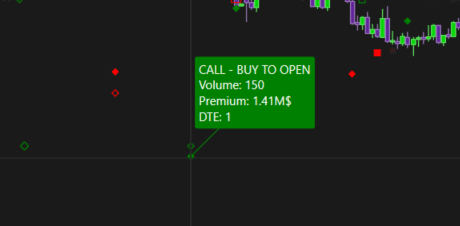
A bought put is bearish, but also shows green by default, since it is still a buy
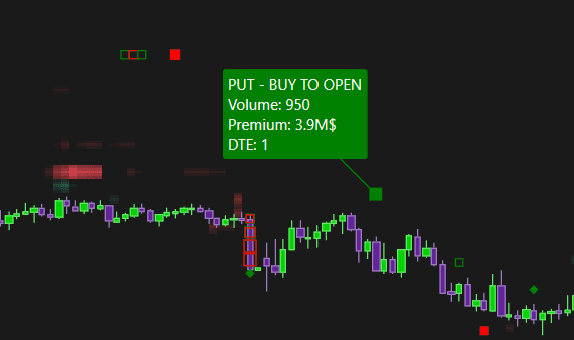
If you want the colors to reflect sentiment instead of the literal action, invert the Put Plot colors in Settings so Buy is red and Sell is green.
With inverted colors, a bought put now shows red, matching its bearish sentiment
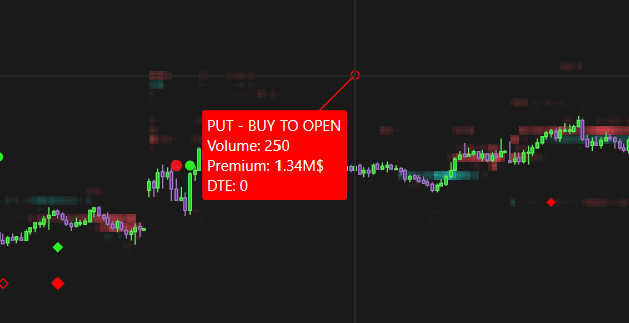
With inverted colors, a sold put now shows green, matching its bullish sentiment
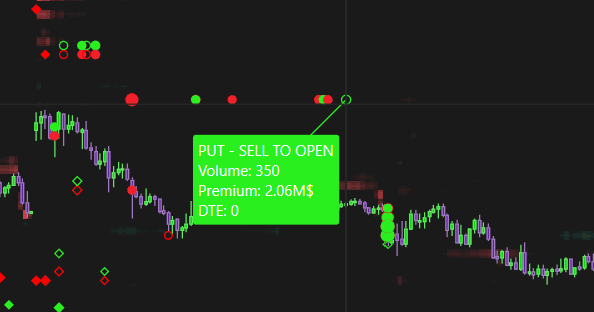
This way, green always means bullish and red always means bearish for Put Plot Colors, making the chart easier to scan at a glance without checking each tooltip.
Note: Only invert the Put Plot colors. If you also invert the Call Plot, the logic will break and the colors will no longer reflect sentiment correctly.
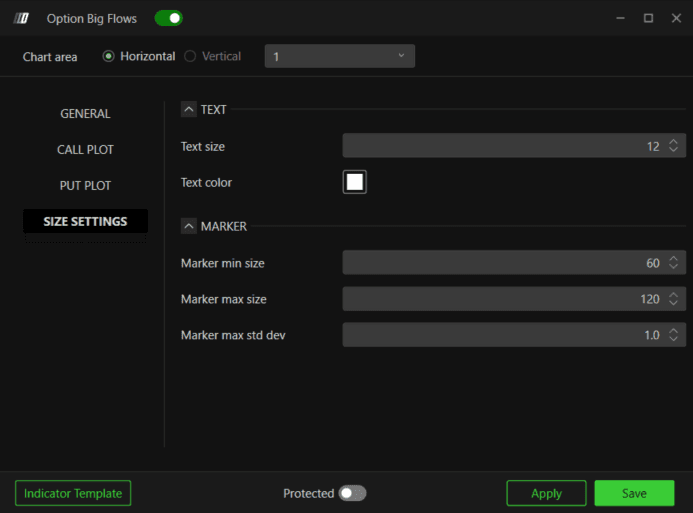
Size Settings
Text
Text size - Set the font size when marker type is set to Text. Default is 12
Text color - Set the text color. Default is white
Marker
Marker min size - Minimum size of the marker. Default is 60
Marker max size - Maximum size of the marker. Default is 120
Marker max std dev - Controls the scaling of marker size relative to standard deviation of premium. Default is 1.0
Example - How to Use Option Big Flows
Once added to your chart, you will see markers appear whenever a large options trade crosses your Min. Premium threshold. Here is a simple way to use them:
A green filled diamond appearing near a key level shows a large call buy opening, often a bullish signal worth watching for continuation
A red filled square appearing at resistance shows a large put buy opening, often a bearish signal suggesting institutional money is positioning for a decline
Hollow markers show positions closing, which can signal that the earlier flow is being unwound or that a trader is taking profit
Clusters of same colored markers around the same price level can highlight a zone where significant institutional activity is concentrated, useful as a level to watch for reactions
Use the Min. Premium filter to focus only on the largest trades if you want to cut out noise from smaller retail sized flow
If you inverted the Put Plot colors, all green markers now consistently mean bullish sentiment and all red markers mean bearish, making it faster to read overall positioning at a glance
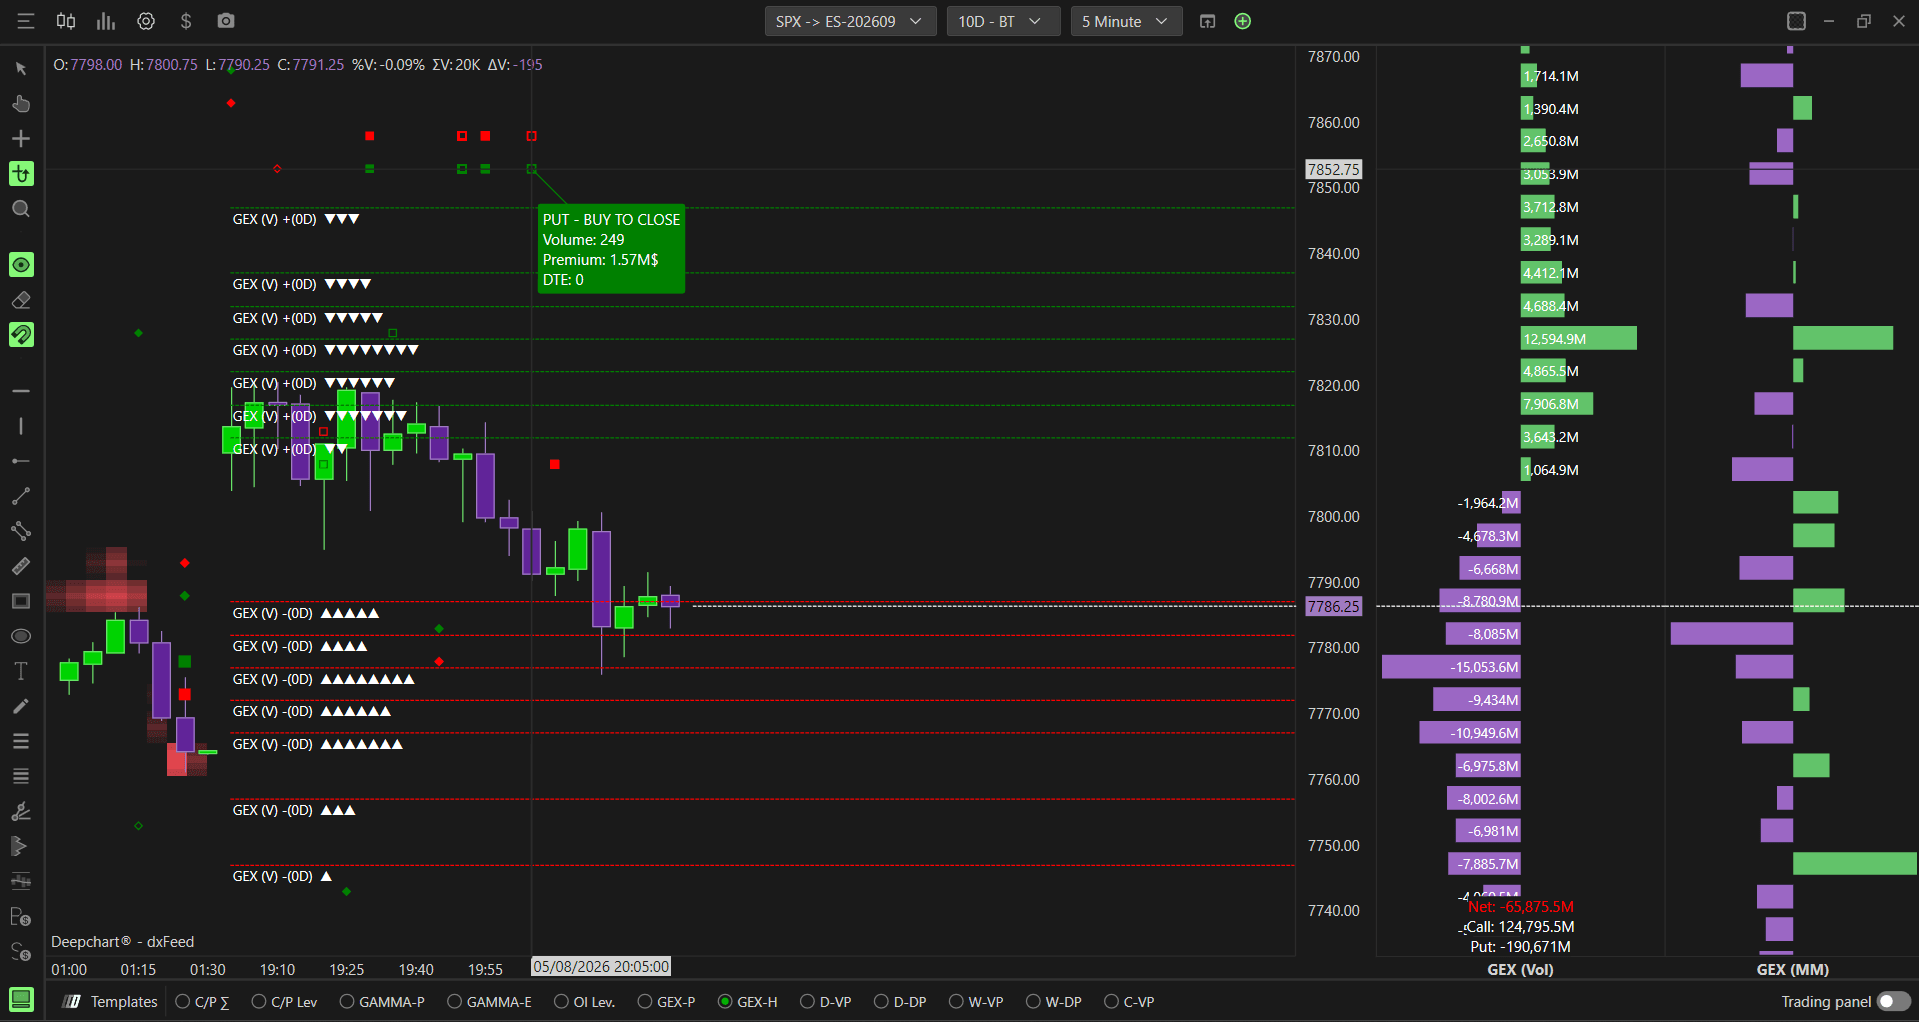
Option Big Flows can also be combined with other indicators for extra context:
Pair it with Option Levels or Option Envelopes to see whether large flows are clustering near existing gamma levels, which can add weight to those levels
Pair it with Option Profile to check whether a large flow lines up with an existing call wall or put wall, since flow near an established wall may reinforce it
Pair it with Option Gex Heatmap to see whether a large flow coincides with a shift in dealer exposure at that strike
Any Questions?
Our support team is available 24/7 and ready to help you with any question.
When reaching out, please include:
Screenshot (if any)
Briefly describe the assistance or support you require
DeepCharts Live Support - Chat with our agents directly using the live chat box on www.deepcharts.com, or click here for 24/7 Live Chat for immediate access.
Email Support - Reach us at support@deepcharts.com - please note that email responses may take a little longer than a live support chat.
