Updated:
Option Gex Heatmap displays the real market maker gamma exposure (GEX) directly on your price chart as colored horizontal blocks. Each block represents a price level where significant dealer gamma exposure exists - teal/cyan blocks indicate positive GEX (call side) and orange/salmon blocks indicate negative GEX (put side). The intensity of the color shows the strength of the exposure at that level.
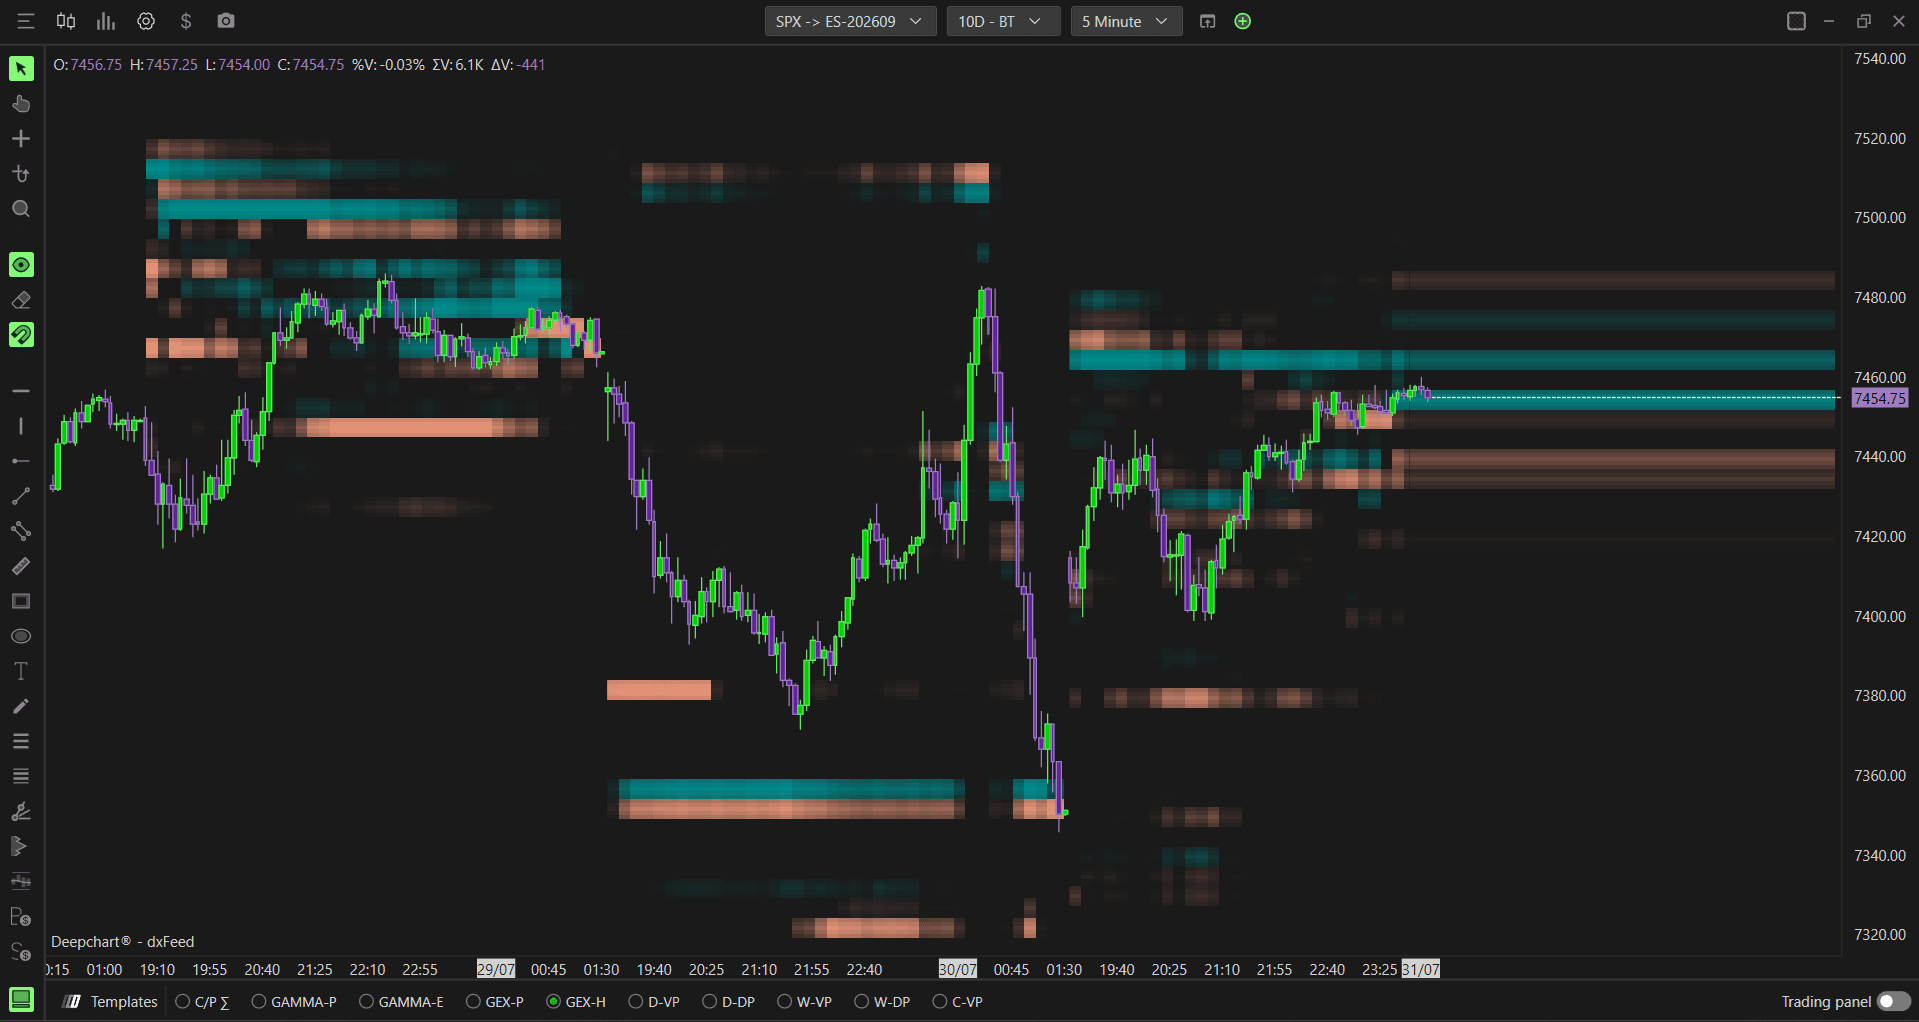
Note: Option Gex Heatmap is available on SPX only, as it requires real CBOE participant data.

How to Add Option Gex Heatmap
Method 1 - Via Indicator Tab
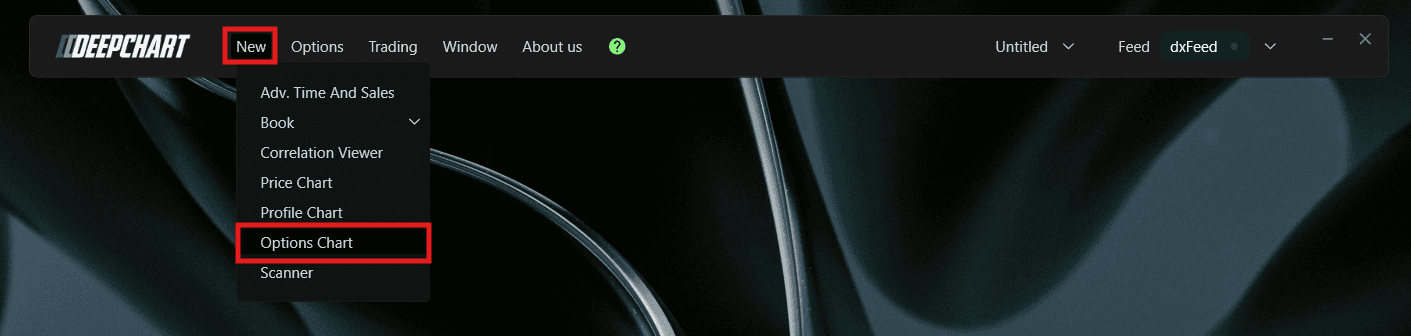
Go to New in the top menu
Click on Option Chart
A Select Instrument dialog will appear. Since Option Gex Heatmap requires CBOE data, select SPX - Symbol: ES-CME, Exchange: CME
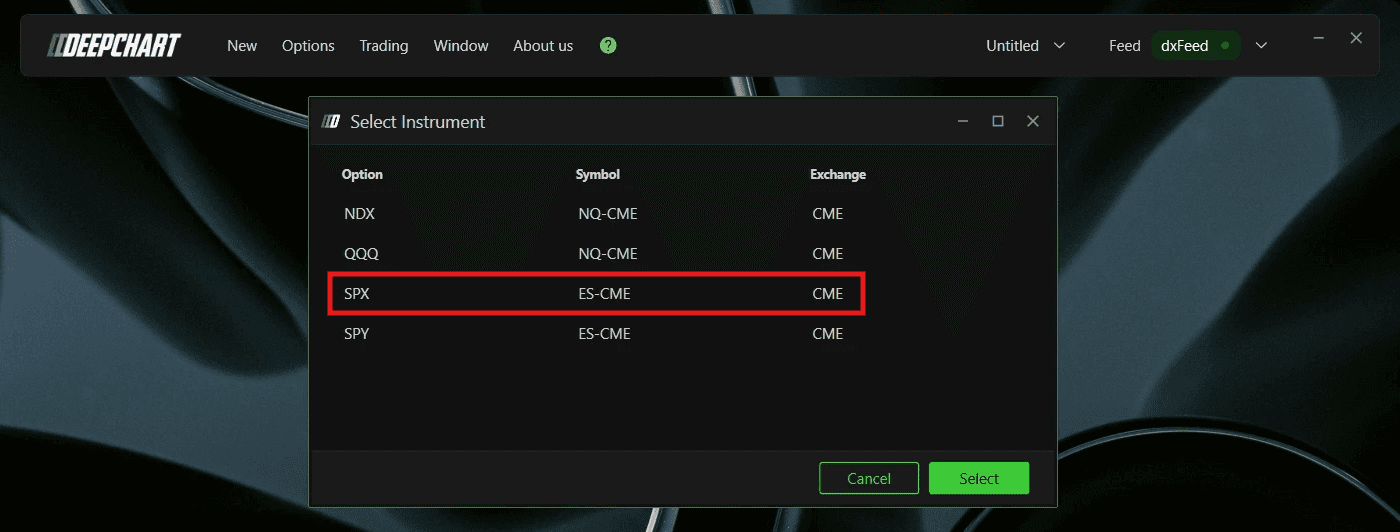
Click to open the chart
Once the Option Chart is loaded, click the Indicator Add button on the chart toolbar
Search for Option Gex Heatmap and click + to add it
Click the settings icon to open the configuration window
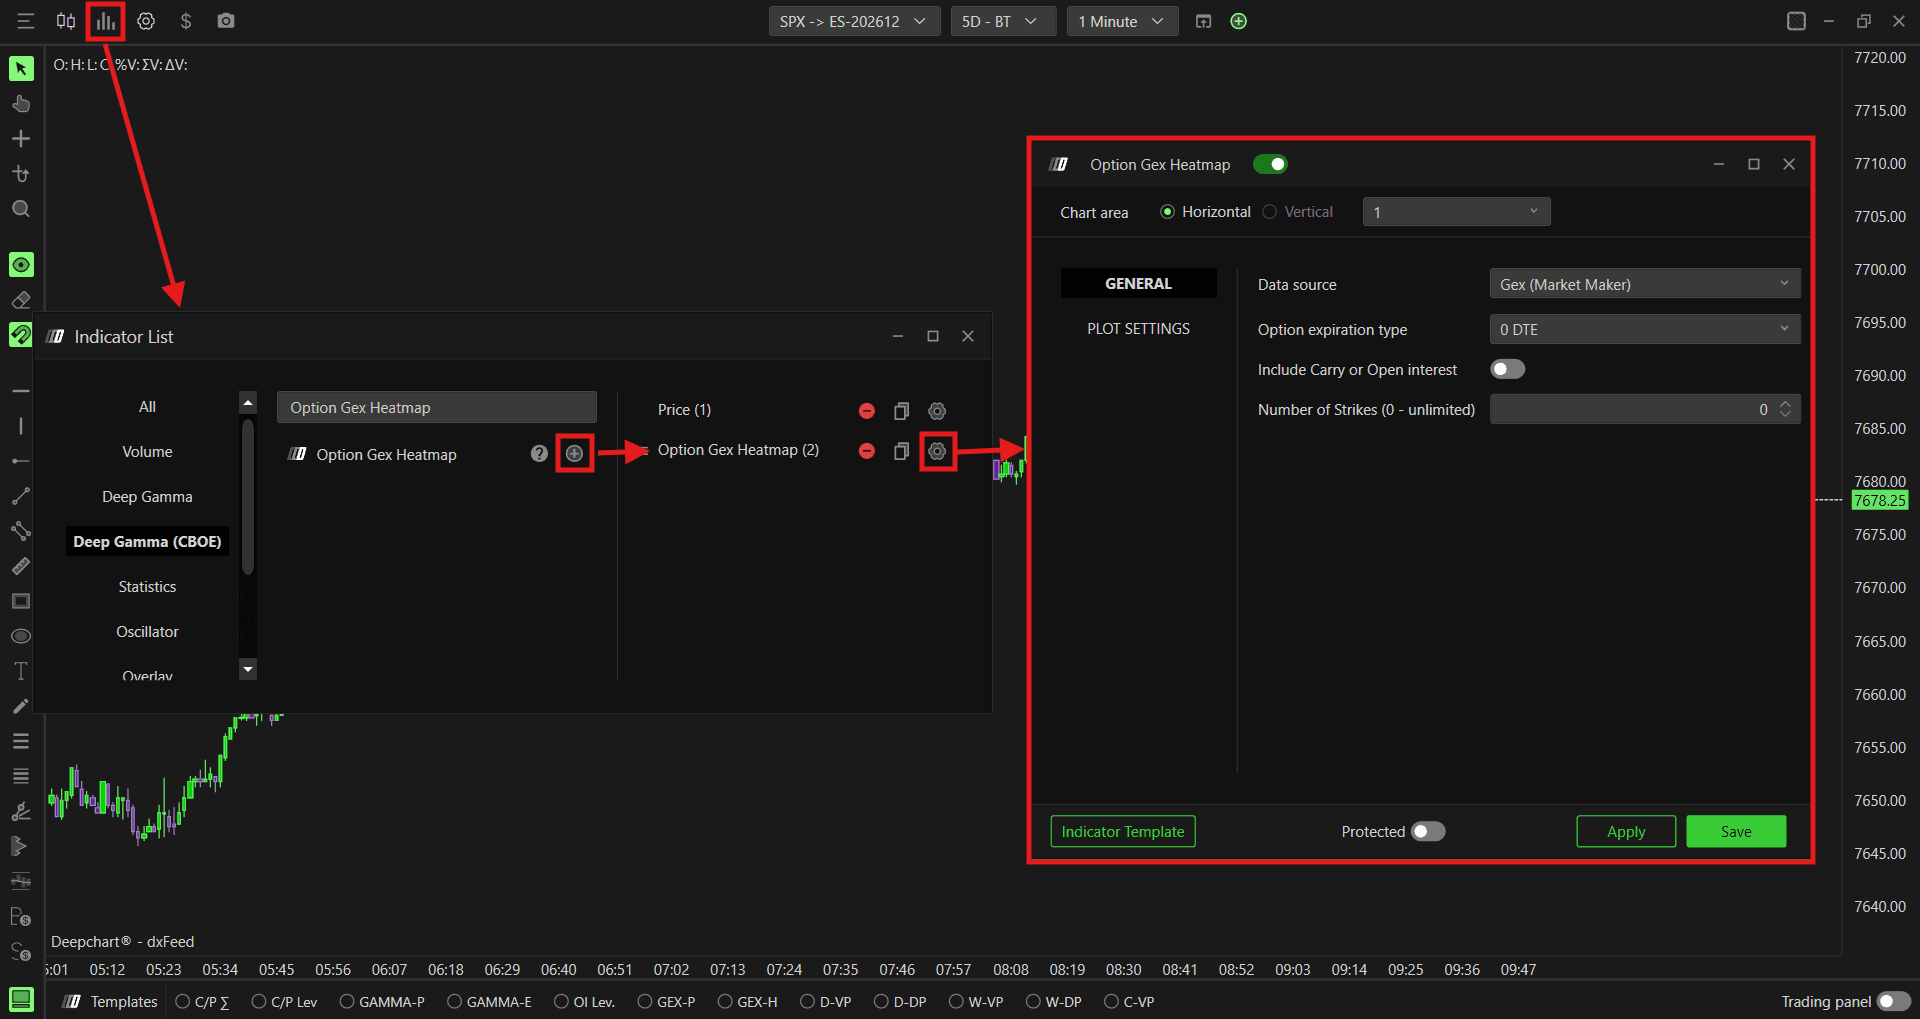
Method 2 - Via Templates Bar
Once the Option Chart is open, you can quickly enable the Option Gex Heatmap directly from the Templates bar at the bottom of the chart.
Locate the Templates bar at the bottom of the Option Chart
Click on GEX-H to instantly load the Option Gex Heatmap on your chart

Once the Option Gex Heatmap is enabled, you can access its settings at any time by right-clicking on the GEX-H tab in the Templates bar and selecting Settings.
Understanding the Heatmap
The Option Gex Heatmap plots colored blocks directly on your price chart:
Teal/Cyan blocks - Positive GEX zones (Call side). These are areas where dealers are long gamma and their hedging activity will dampen price moves. Price approaching these zones may find resistance or slow down
Orange/Salmon blocks - Negative GEX zones (Put side). These are areas where dealers are short gamma and their hedging activity will amplify price moves. Price breaking through these zones may accelerate
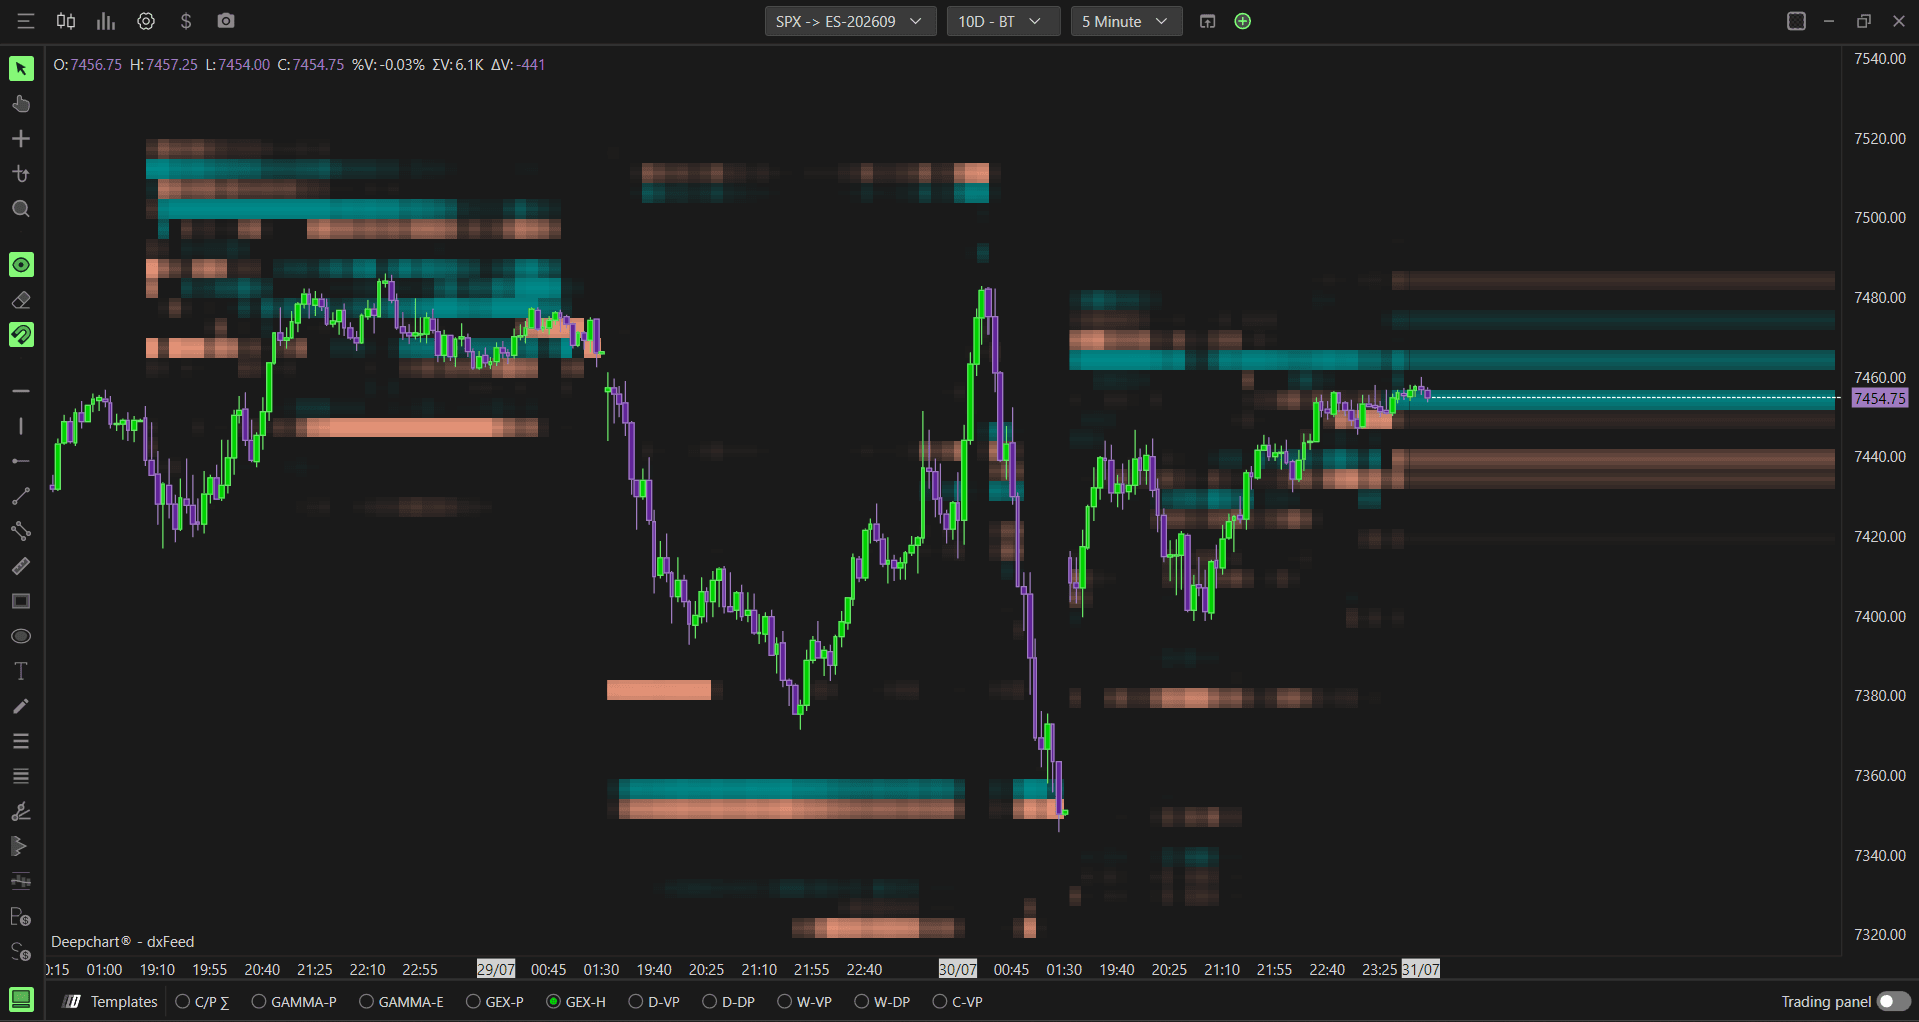
The stronger and wider the block, the more significant the dealer exposure at that level.
Understanding Key Terms
Before choosing a data source, it helps to understand a few core options concepts:
Call - An option that gives the buyer the right to buy the underlying at a set price. Traders buy calls when they expect price to go up
Put - An option that gives the buyer the right to sell the underlying at a set price. Traders buy puts when they expect price to go down
Gamma - A measure of how much an option's delta changes as price moves. High gamma means dealers need to hedge more aggressively as price approaches a strike
GEX (Gamma Exposure) - An estimate of the gamma exposure dealers are carrying at a given strike, combining volume with the gamma greek
DEX (Delta Exposure) - An estimate of the delta exposure dealers are carrying at a given strike, showing directional hedging pressure rather than gamma sensitivity
OI (Open Interest) - The total number of option contracts currently open and not yet closed or expired
OI-R (Real-Time Open Interest) - Since official exchange open interest is only released at end of day, DeepChart calculates open interest in real time from live CBOE buy and sell flow. For example, if there are 2 sells and 1 buy, there is a net open position of 1. This gives an up to date view of open interest without waiting for the exchange's end of day figures
Market Maker Net Flow - The net delta flow generated specifically by market maker buy and sell activity, isolating dealer side positioning from overall market activity
Settings
General
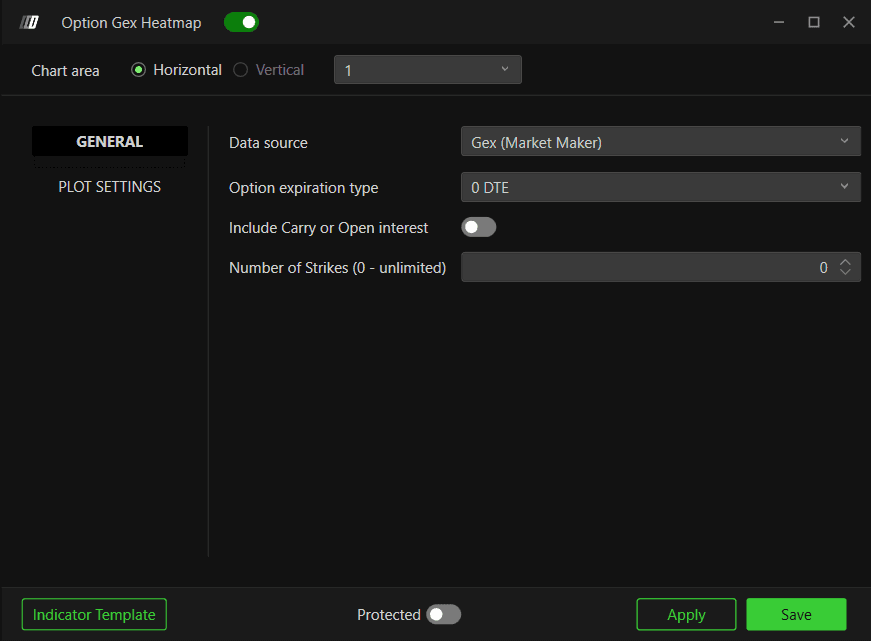
Data source - Choose what data is used to build the heatmap. Options available:
Gex (Market Maker) (default) - uses real CBOE reported market maker gamma exposure, also known as the "convexity ladder" on other platforms. This is the most accurate source, since it reflects actual reported dealer positioning rather than an assumption.
Use this when: you want the most reliable read on where real dealer gamma hedging pressure existsGex (Call - Put) - calculates gamma exposure using the standard assumption that market makers are long calls and short puts, also known as "classic" GEX on other platforms.
Use this when: you want to compare the naive gamma calculation against the real market maker dataDex (Market Maker) - uses real CBOE reported market maker delta exposure, also known as the "DEX ladder" on other platforms.
Use this when: you want to see dealer directional hedging pressure rather than gamma sensitivityGex (Call OI-R - Put OI-R) - calculates gamma exposure using real time open interest as the base instead of session volume, also known as "state" GEX on other platforms. This reflects gamma exposure tied to standing positions rather than the current session's trading activity.
Use this when: you want a structural view of gamma exposure based on live positioning, rather than one driven by today's volumeMarket Maker Net Flow - shows the net delta flow generated by market maker buy and sell activity.
Use this when: you want to isolate dealer side flow specifically, separate from overall market activityCall/Put Σ - displays raw call and put options volume with no gamma weighting.
Use this when: you want a simple read on where the most contracts are tradingCall Σ - Put Σ - displays the net difference between call and put volume.
Use this when: you want to spot directional skew in raw contract activityCall/Put OI-R - displays real time open interest for calls and puts.
Use this when: you want to see live standing positions without any gamma weighting
Option expiration type - Filter the heatmap by expiration. Options available: 0 DTE, <= 1d, <= 2d, <= 3d, <= 4d, <= 5d, <= 6d, <= 7d, <= 31d, <= 91d, All expirations. Default is 0 DTE
Include Carry or Open Interest - When enabled, includes open interest carried over from previous sessions into the calculation, giving you a broader view of total positioning. When disabled, only the current session data is considered. Default is disabled
Number of Strikes (0 - unlimited) - Sets how many strikes out from the current price to include in the heatmap. A value of 0 includes an unlimited number of strikes. Default is 0
Plot Settings
Intensity
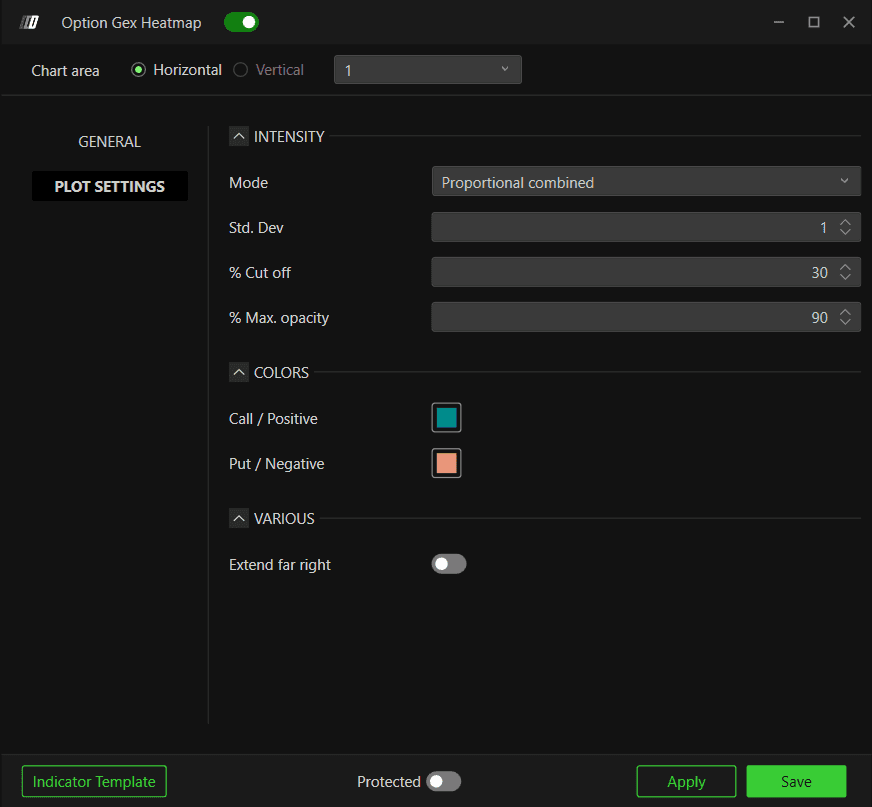
Mode - Controls how the color intensity of the heatmap blocks is scaled. Options available:
Proportional session - scales color intensity based on the current session values only. The strongest block in the current session gets the maximum color intensity
Proportional time average - scales color intensity based on the same time of day from previous sessions. This accounts for the fact that gamma values change throughout the day as expiration approaches
Proportional combined (default) - uses a 50/50 weight between the current session and the previous session time average. This is the recommended setting as it balances real time activity with historical context
Std. Dev - Sets the standard deviation threshold used for scaling the intensity. Default is 1
% Cut off - Sets the minimum percentage threshold below which blocks are not displayed. Increasing this value filters out weaker GEX levels and shows only the most significant zones. Default is 30
% Max. opacity - Sets the maximum opacity of the heatmap blocks. Default is 90
Colors
Call / Positive - Set the color for positive GEX (call side) blocks. Default is teal/cyan
Put / Negative - Set the color for negative GEX (put side) blocks. Default is orange/salmon
Various
Extend far right - When enabled, extends the heatmap blocks further to the right side of the chart beyond their normal range, useful for projecting current levels forward for easier visual reference. Default is disabled
Example - How to Use Option Gex Heatmap
Once added to your chart, you will see colored blocks plotted directly on your price chart at key GEX levels. Here is a simple way to read it:
Large teal blocks above price - These are significant call side GEX zones. Price approaching these levels may slow down or reverse as dealer hedging creates selling pressure. Look for absorption or rejection signals when price enters these zones
Large orange blocks below price - These are significant put side GEX zones. Price approaching these levels may find support as dealer hedging creates buying pressure. Look for bounces or slowing momentum when price enters these zones
Price breaking through a block - When price pushes through a significant GEX block, it can trigger accelerated moves as the hedging dynamic shifts. This is especially true when price crosses from positive to negative GEX territory
Any Questions?
Our support team is available 24/7 and ready to help you with any question.
When reaching out, please include:
Screenshot (if any)
Briefly describe the assistance or support you require
DeepCharts Live Support - Chat with our agents directly using the live chat box on www.deepcharts.com, or click here for 24/7 Live Chat for immediate access.
Email Support - Reach us at support@deepcharts.com - please note that email responses may take a little longer than a live support chat.
