Indicators
Updated:
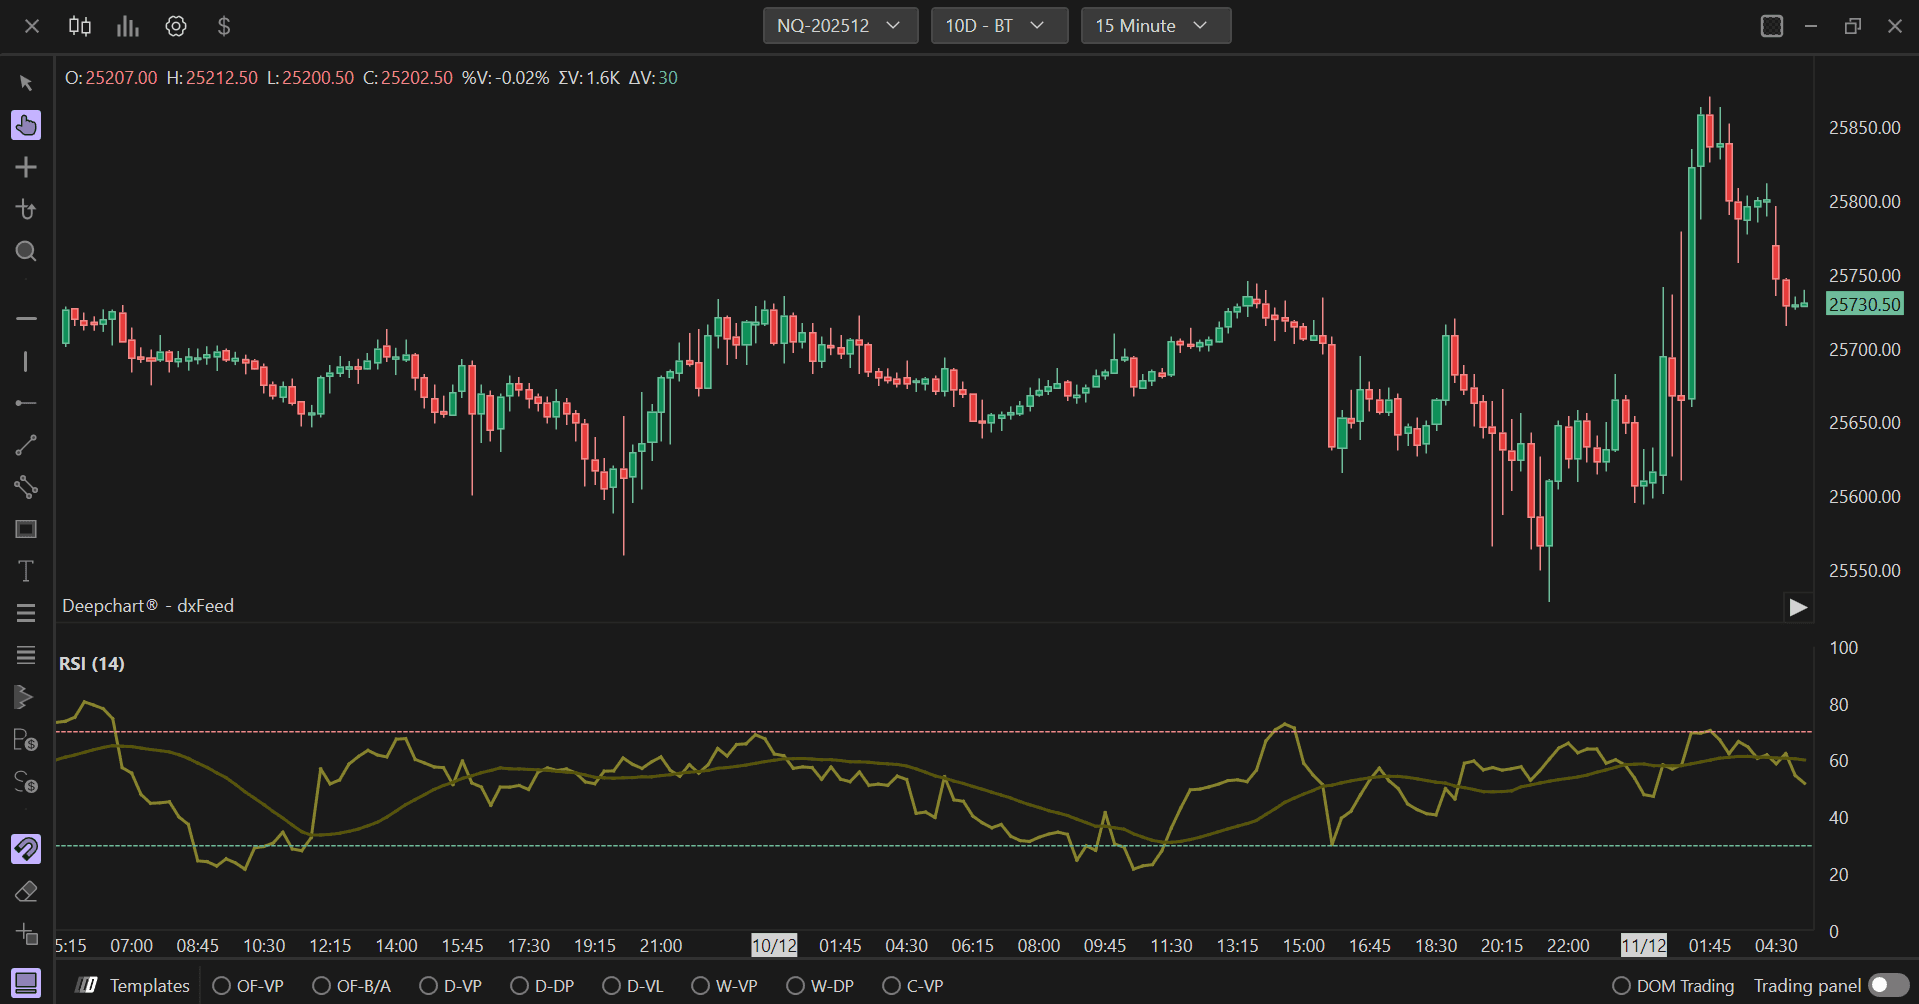
The RSI (Relative Strength Index) is one of the most popular technical analysis indicators and is used to measure the strength or weakness of an asset's price over a given period of time.
The RSI is a momentum indicator developed by J. Welles Wilder and ranges on a scale of 0 to 100. Its main purpose is to identify overbought or oversold conditions, which may indicate a reversal or consolidation of price. The RSI indicator compares the absolute value of price increase for a given period of time with its level of decline for the same period. The result of the calculation is shown in the form of a curve on the chart, with values ranging from 0% to 100%.
Using Settings
Clicking on the indicator settings icon will open its configuration window, within which you can make several choices regarding the indicator's functionality.
Parameters
The Parameters section is divided into a few sub-sections:
General
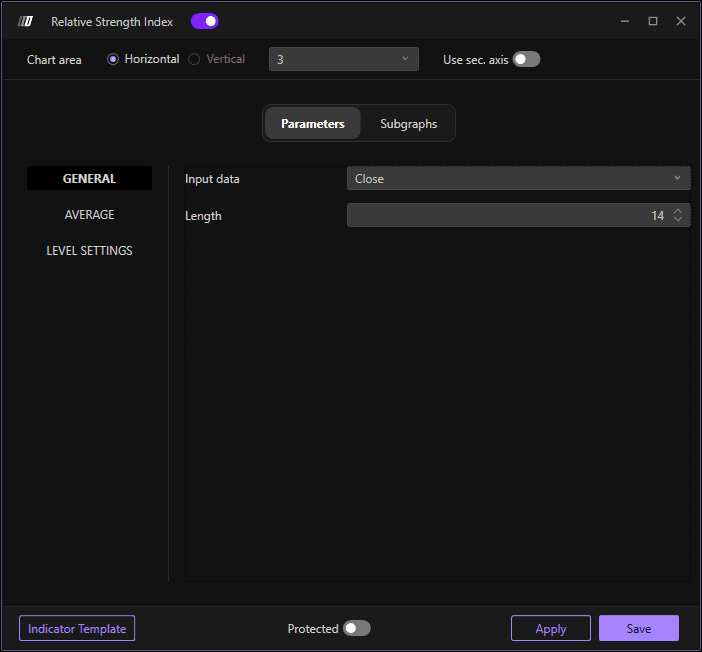
Allows you to select:
Input data: The price data to use for calculation
Length: The number of periods for the RSI calculation (default: 14 )
Average
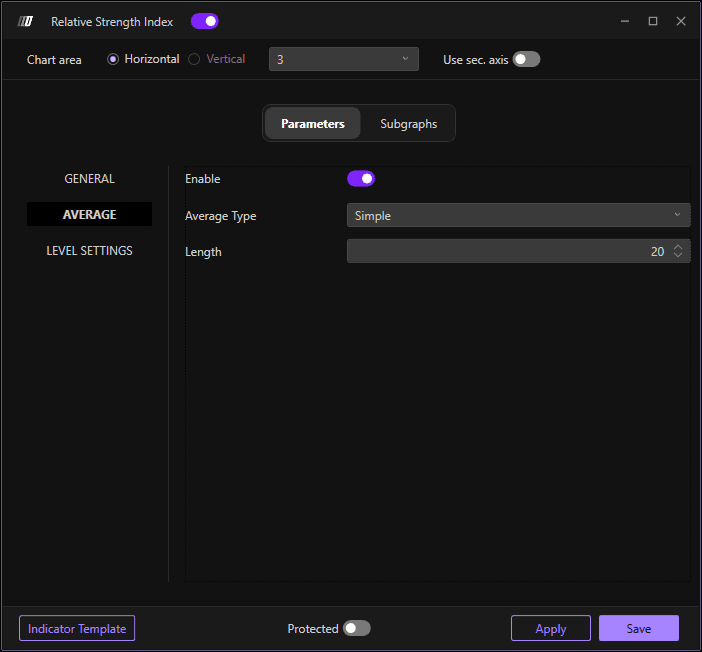
Allows you to:
Enable: Toggle averaging on or off
Average Type: Choose the averaging method
Length: Set the number of periods for the average (default: 20)
Level Settings
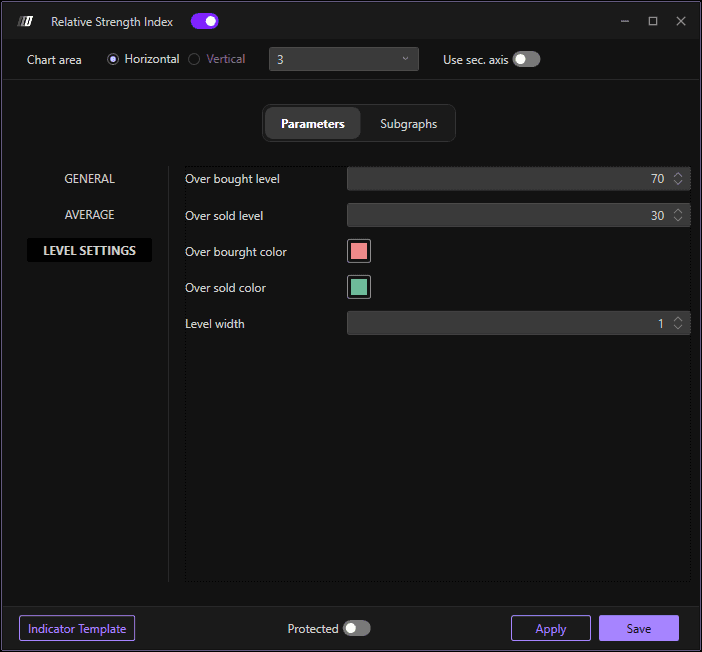
Allows you to change the values and style:
Overbought Level: Set the overbought level (default: 70)
Oversold Level: Set the oversold level (default: 30)
Overbought Color: Color for the overbought threshold line
Oversold Color: Color for the oversold threshold line
Level Width: Define the width of the threshold lines (default: 10)
Subgraph
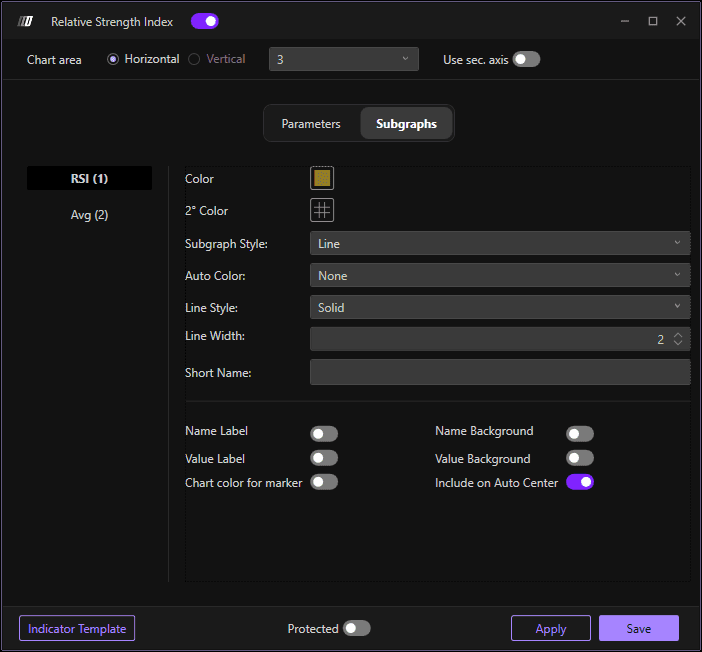
In the Subgraph section, you can change the colors and style of the RSI graph and its average:
RSI Color: Set the color of the RSI line
Average Color: Set the color of the average line
Secondary Color: Set an optional secondary color
Subgraph Style: Choose the display style
Line Style: Define the line style
Line Width: Define the width of the indicator lines
Use Secondary Axis: Option to display on a secondary axis