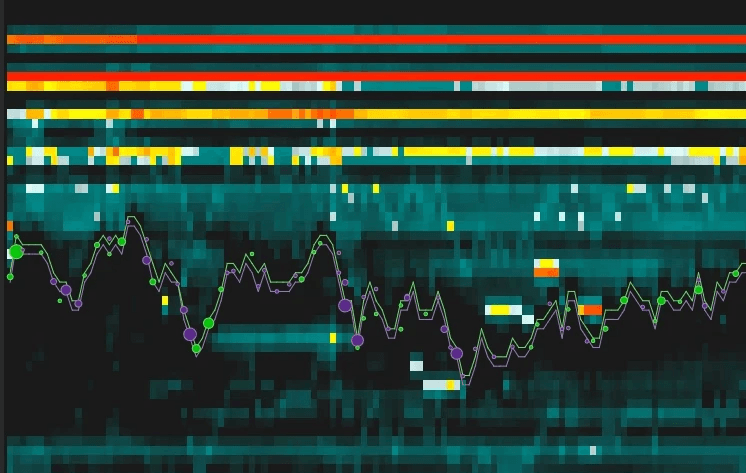
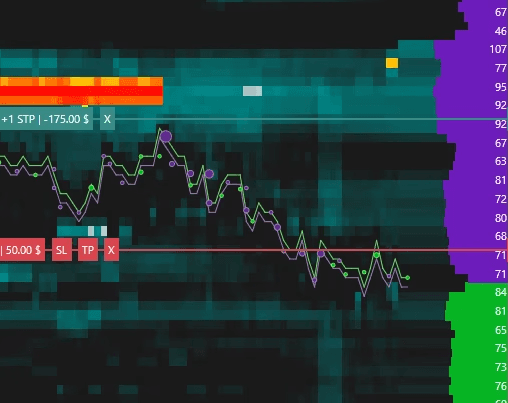

This release introduces major improvements to order flow analysis, market depth visualization, chart management, platform performance, and several indicators. Please review the important notes below, especially if you plan to use the new Deep Trades indicator.

Chart Management
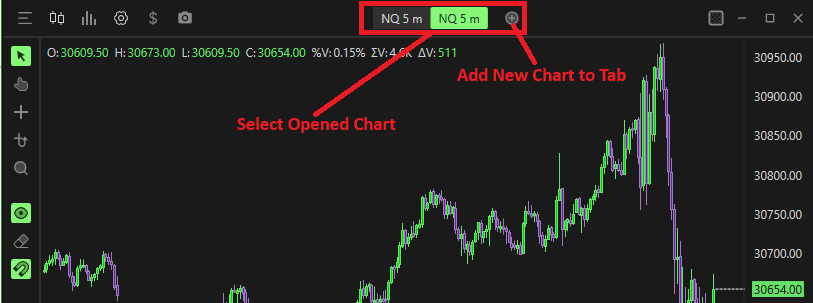
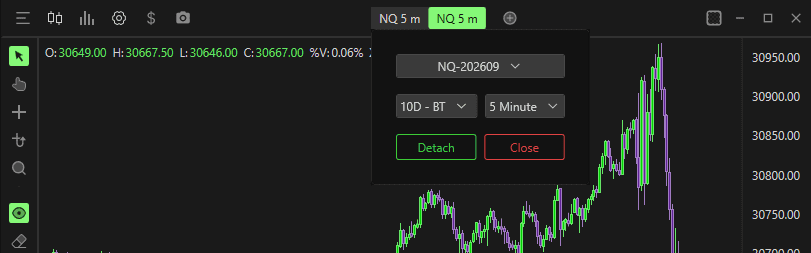
Improved Chart Creation Workflow
The Add Chart button (Plus Icon) has been improved for a smoother workflow.
When adding a chart:
A new chart tab is created automatically.
The chart can be changed immediately.
To modify the chart:
Right-click the newly created tab.
Select the desired chart configuration.
Compact Chart Tabs
For users who prefer a cleaner workspace:
Location: Options → Settings → General → Chart
Enable: Chart Tabs → Compact Mode
Chart Grouping
Charts located in separate windows can now be grouped together.
The Group button is located next to the Add Chart button.
Example: Group ES-202609 1 Minute
Grouped charts can:
Stay synchronized
Be attached to other chart windows
Be detached later using the right-click menu
This provides greater flexibility for multi-monitor trading setups.
DOM
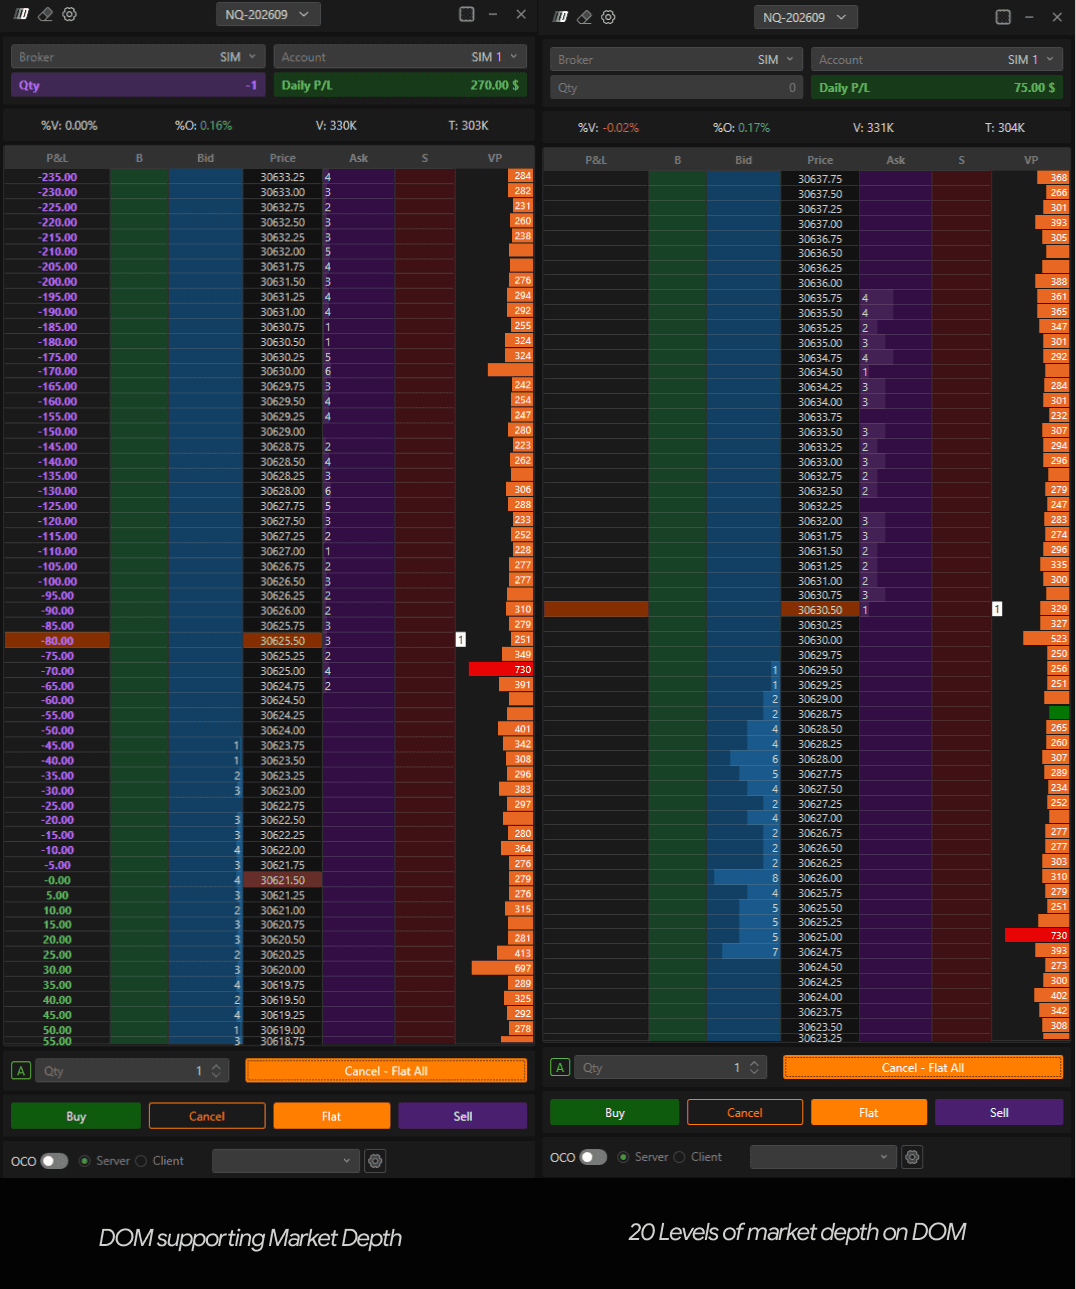
Full Depth DOM Support
The DOM now supports displaying the full market depth provided by your data feed.
For traders who prefer a more compact DOM, you can limit the number of visible levels.
Location: DOM Settings → Number of Levels Show
Example:
Set the value to 20 to display only 20 levels above and below the market.
Set a higher value to display more depth.
Leave unrestricted to view the full market depth available from your provider.
Big Trades (formerly Deep Trades)
The existing Deep Trades indicator has been renamed to Big Trades.
This is a name change only.
No functionality has changed and all existing behavior remains the same.
Deep Trades (New Indicator)
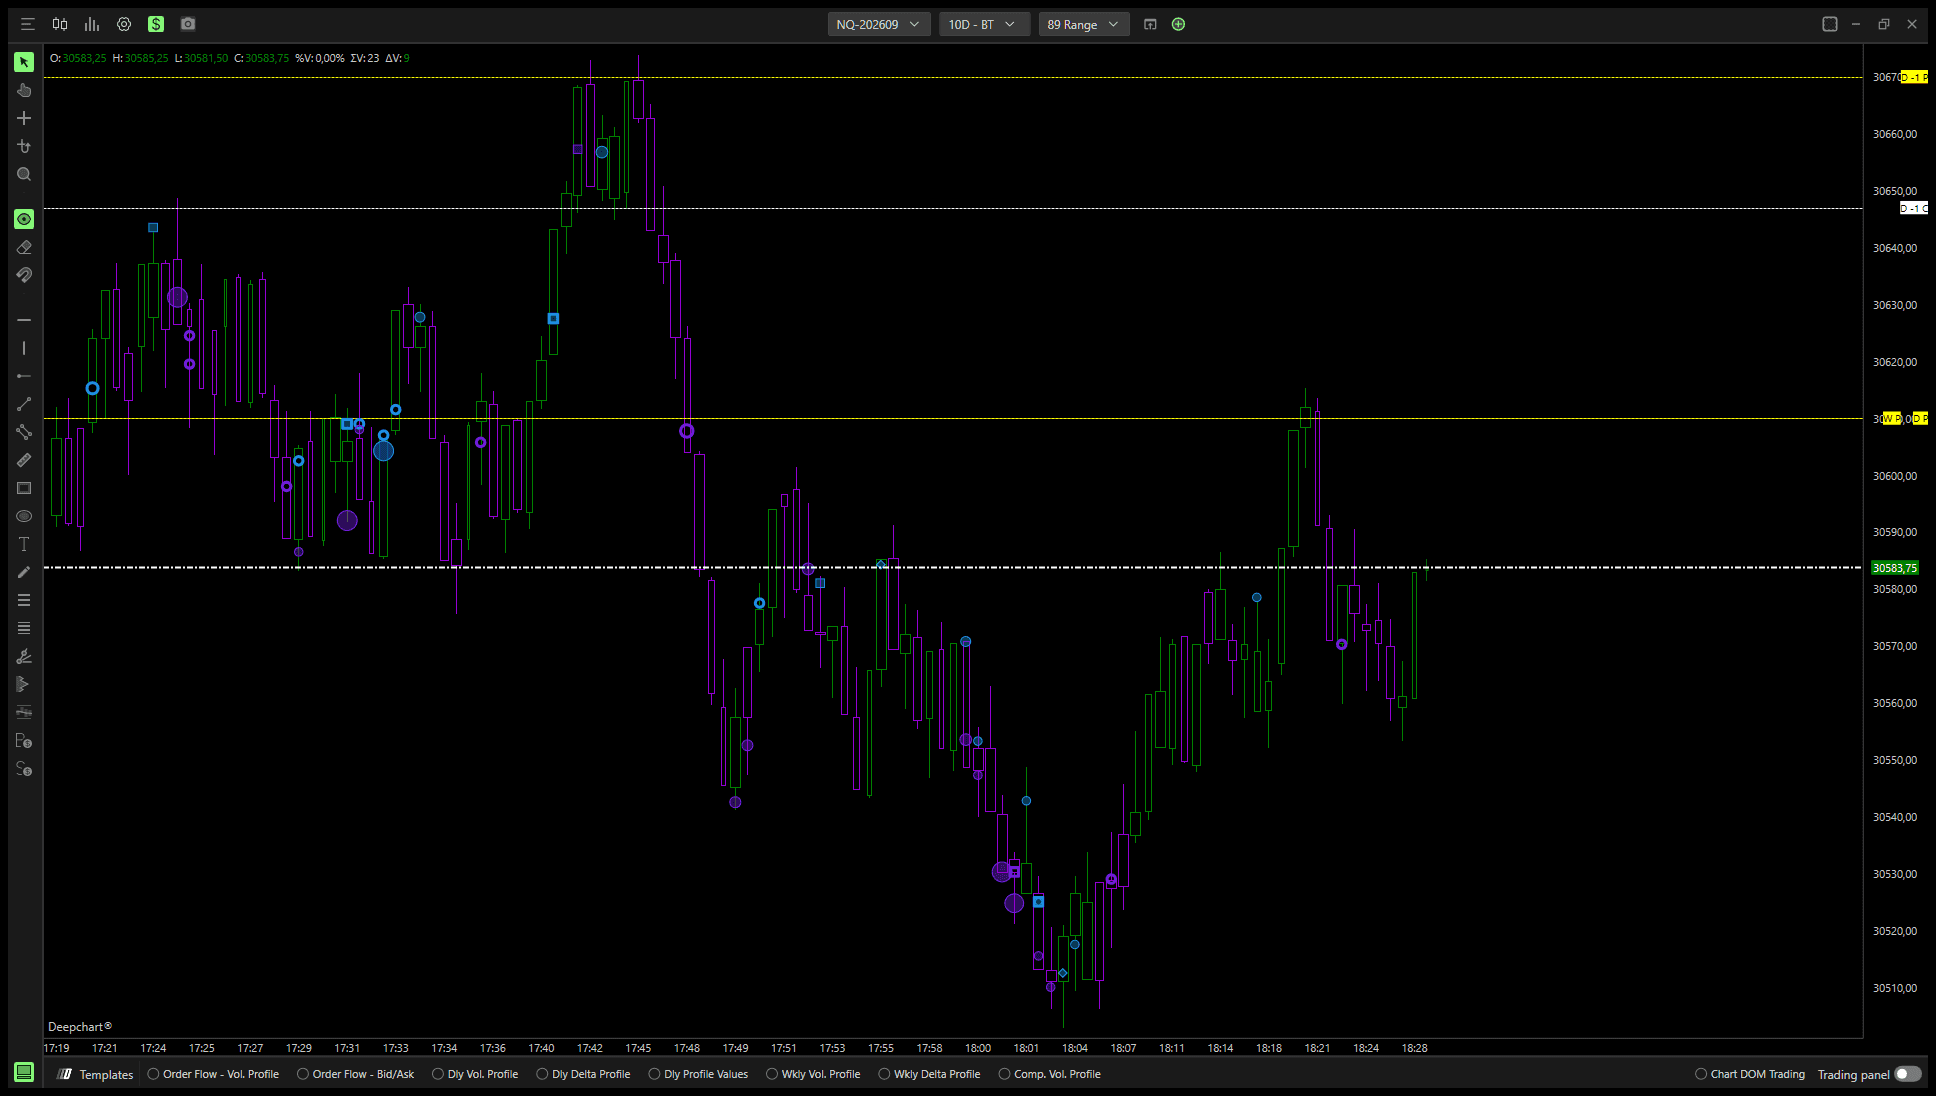
A brand-new indicator called Deep Trades has been introduced.
Unlike Big Trades, Deep Trades utilizes MBO (Market By Order) data and provides deeper insight into how large market activity is executed.
Deep Trades Symbols
Deep Trades classifies large activity using four different symbol types.
○ Open Circle
Large trade composed of multiple smaller trades that have been aggregated together.
● Filled Circle
Large trade generated by a single large order.
■ Square
Large passive order. Represents liquidity resting in the market.
◆ Diamond
Large aggressive order. Represents liquidity actively hitting the market.
Input Data Selection
Deep Trades does not require users to select an input source.
The indicator automatically calculates and classifies activity directly from MBO trade information.
MBO Data Requirements
Deep Trades requires MBO data.
Currently supported providers include:
Rithmic
dxFeed
Rithmic Users
Rithmic Level 1 is enough to support Deep Trades.
dxFeed Users
dxFeed users must have:
Level 2 subscription
DOM Type set to MBO within Feed Settings
Without these requirements, Deep Trades will not function correctly.
Historical Data Collection
MBO historical data cannot be downloaded from the provider.
Instead, DeepCharts stores MBO data locally while the platform is running.
As real-time MBO data is collected, it is automatically saved and becomes available as historical data for future sessions.
Important Notes
Historical Deep Trades data only exists if it was previously collected in real time.
Historical MBO data cannot be backfilled from the provider.
New installations already support this functionality automatically.
Required Migration for Existing Users
Existing users must perform a database migration before historical Deep Trades data can be stored correctly. New users do not need to perform this step.
Location: Options → Database → Settings → Migrate / Compress
Steps
Open Database Settings
Select Migrate / Compress
Click Yes
Click OK
Wait for completion
The migration process may take approximately 10–15 minutes depending on database size.
If you are collecting Deep Trades data in real time but cannot view historical records later, this migration is likely required.
Deep Print (Order Flow / Bid Ask)
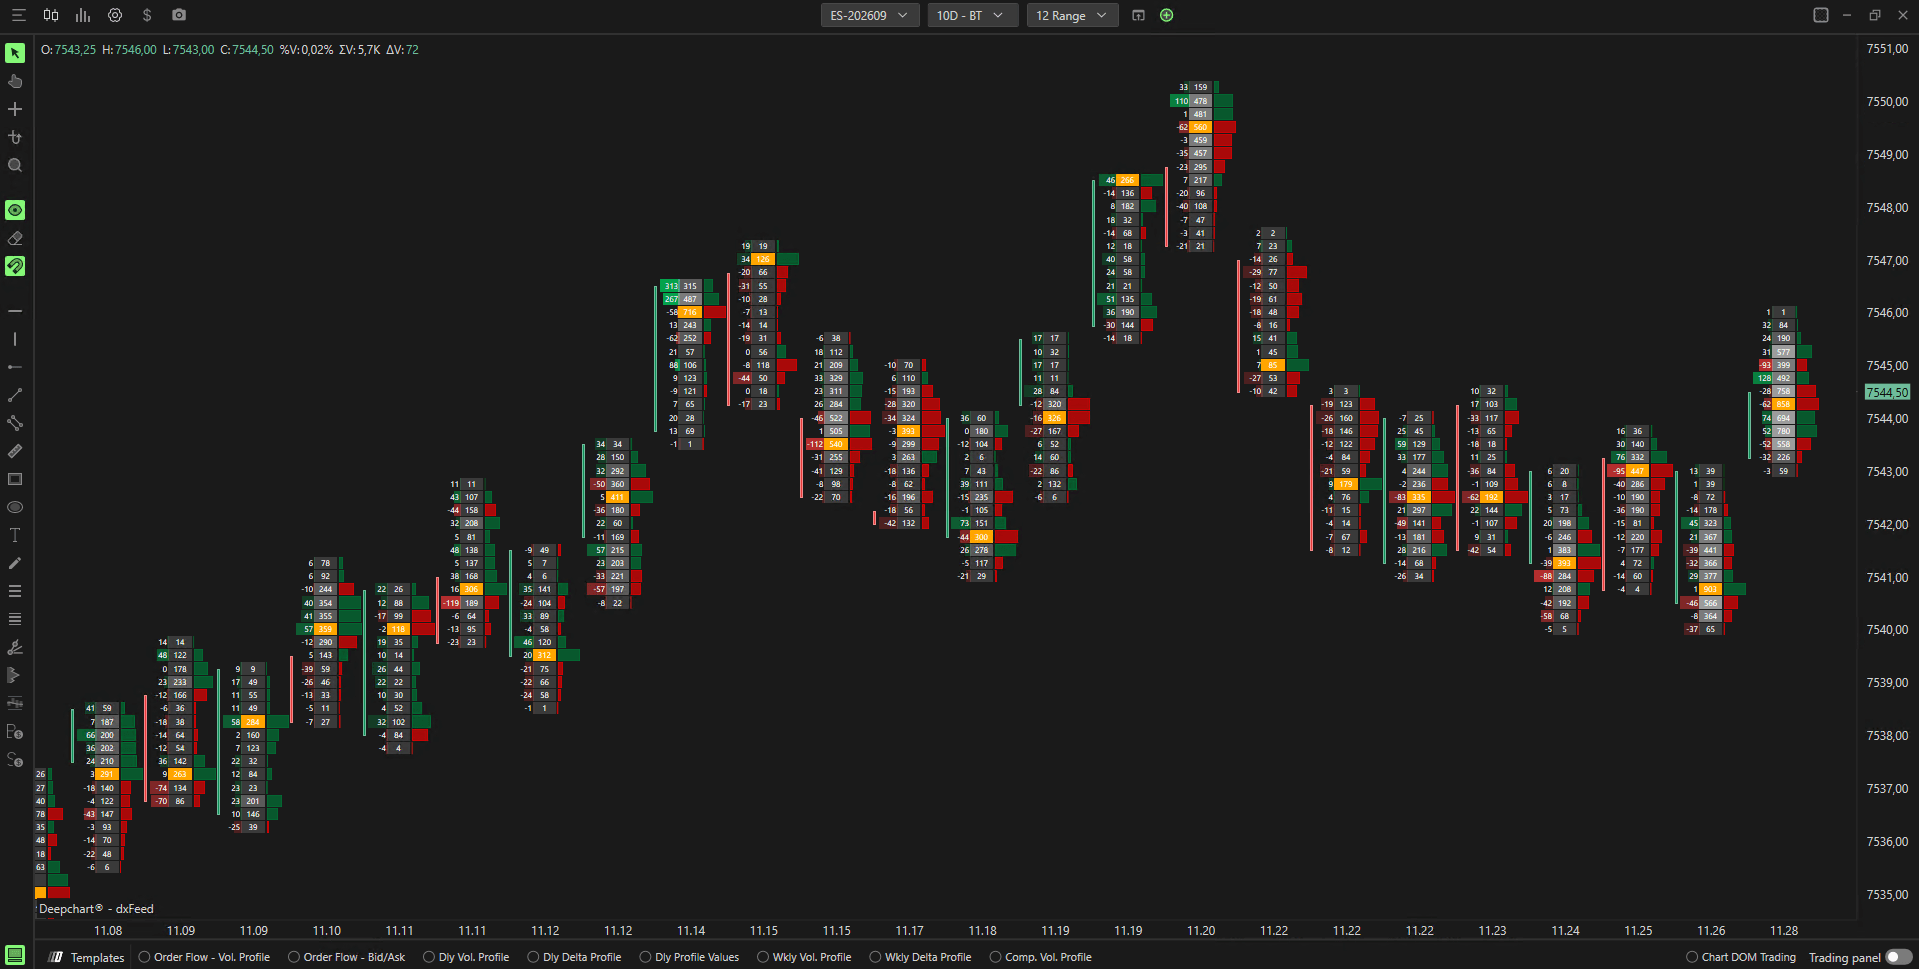
Several major usability improvements have been added to Deep Print.
Enhanced Zoom Experience
Users can now zoom out significantly further while maintaining readability.
Previously:
Zooming out too much made footprint values difficult to read.
Now:
Text automatically scales smaller.
More market structure remains visible.
Larger chart context can be viewed without losing footprint information.
Multi-Column Deep Print Layouts
Deep Print now supports displaying multiple footprint views side by side.
Users can configure up to four simultaneous columns.
Setup Instructions
Add multiple Deep Print indicators.
Open settings for each Deep Print.
Navigate to:
Sizing → Multi ColumnSet the desired number of columns.
Assign a unique position for each Deep Print.
Customize each Deep Print independently.
Examples include:
Bid x Ask
Delta
Volume
Custom footprint configurations
All can be displayed simultaneously. Maximum supported columns: 4
Database Optimization
New Migrate / Compress Utility
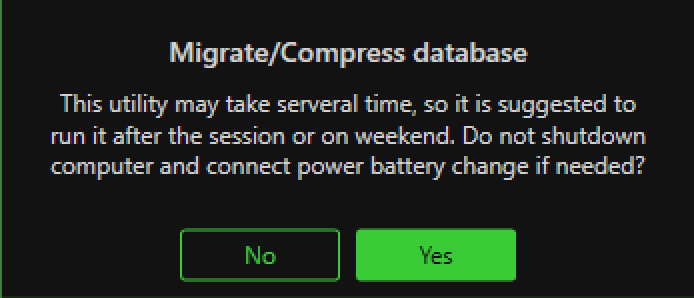
A new database maintenance utility has been introduced.
Location: Options → Database → Settings → Migrate / Compress
Benefits include:
Database size reduction of up to 90%
Faster startup times
Reduced storage usage
Improved platform performance
Better performance on virtual machines
This is particularly beneficial for users running DeepCharts through virtualization environments such as Parallels on Mac.
We recommend periodically running the compression utility for optimal performance.
On Candle Stats Indicator
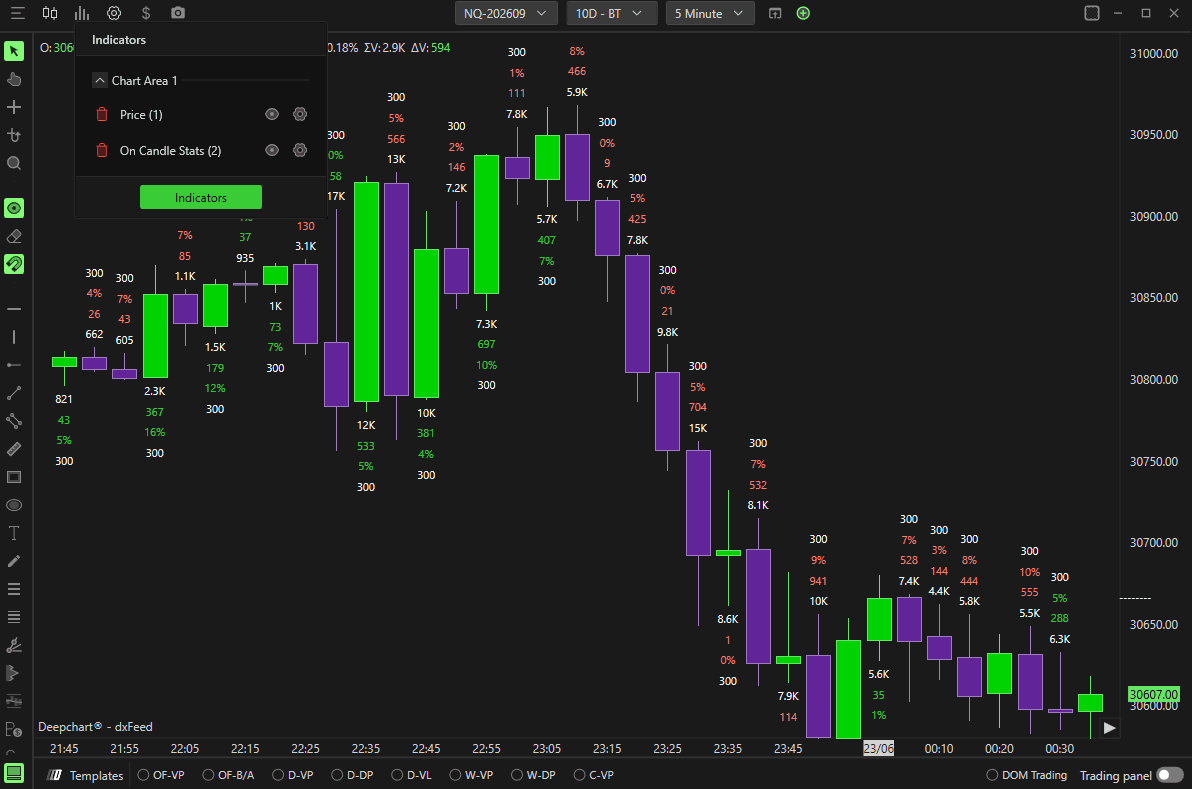
Candle Duration Display
The On Candle Stats indicator can now display candle duration directly on the chart.
Setup
Settings → Time(s)
At the bottom-left section: Subgraph Style → Text
Once enabled:
Candle duration is displayed above each candle
Values are displayed in seconds
Fully customizable through indicator settings
Users can modify:
Color
Font
Text appearance
Fair Value Gap Identifier (FVG)
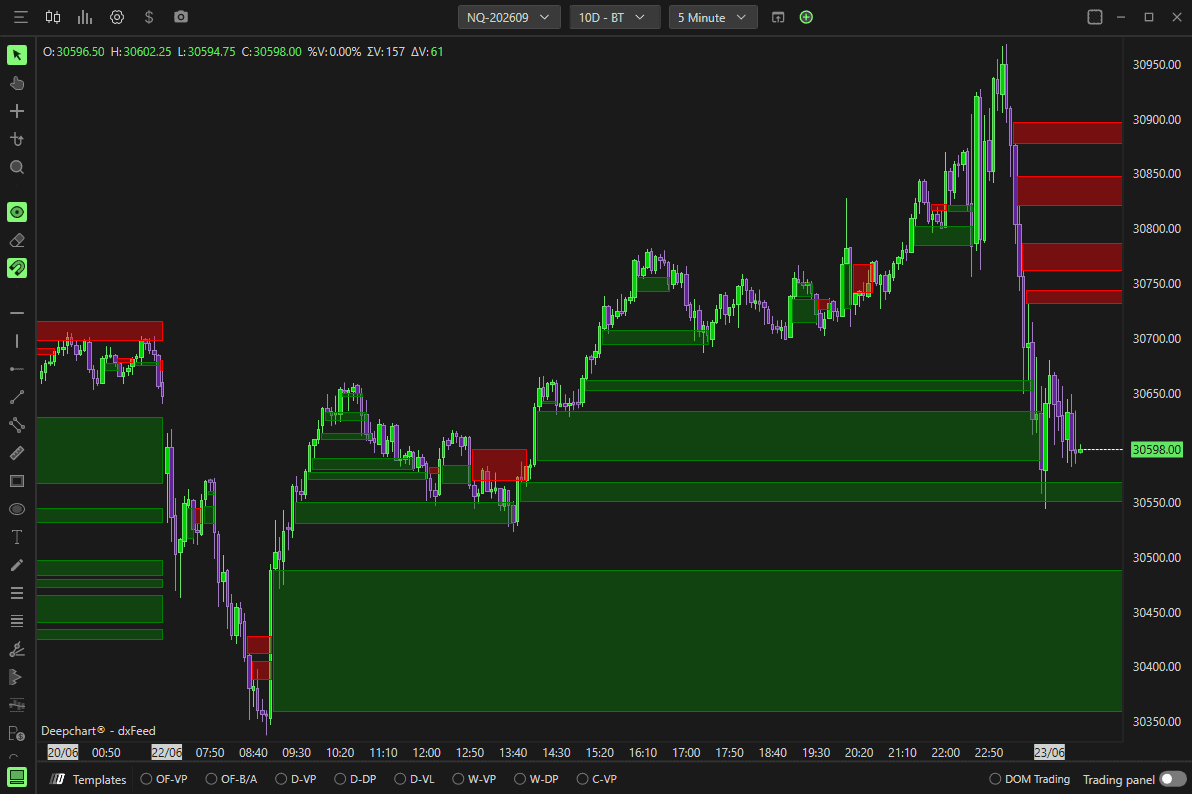
Separate Buy and Sell Colors
The FVG indicator now supports independent color customization for bullish and bearish gaps.
Users can customize:
Buy-side FVG color
Sell-side FVG color
This provides improved visual clarity and personalization.
NQ Efforts Indicator
Alert Support Added
Alert functionality has been added to the NQ Efforts indicator. Features include:
Alert notifications
Alert sound selection
Sound preview directly from settings
Users can now test alert sounds before applying them.
Imbalance Tracker Indicator
New Calculation Modes
Two new calculation methods have been added.
Imbalance Horizontal
Functions similarly to Imbalance Diagonal but performs calculations horizontally across price levels.
Delta Percentage Horizontal
Calculates delta percentage relationships horizontally across the footprint.
These new modes provide additional ways to analyze market imbalances.
Trade Copier
Performance and Speed Improvements
The Trade Copier has received significant backend optimizations. Benefits include:
Faster execution
Lower latency
Improved synchronization
Better reliability during active market conditions
Screenshot System
New Screenshot Modes
DeepCharts now provides multiple screenshot workflows.
Location: Options → Settings → General → Various → Screenshot Mode
Available options include:
Auto Save
Automatically saves screenshots directly to the configured screenshot folder.
Save Dialog
Displays a save dialog each time a screenshot is taken, allowing the user to choose a location.
Copy
Copies the screenshot directly to the clipboard. The image can then be pasted into:
Discord
Telegram
Email
Documents
Social media
Copy and Auto Save
Performs both actions simultaneously.
Taking Screenshots
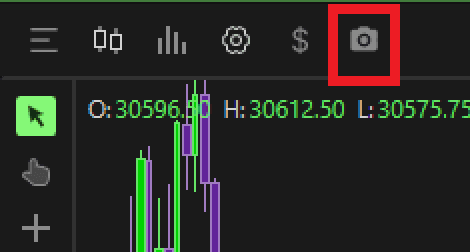
To capture a screenshot, click the Camera icon located in the upper-left chart toolbar.
Important Levels Indicator
Time Filtering Added
The Important Levels indicator now supports time-based filtering. Examples include:
Display only opening levels
Focus on specific market periods
Reduce unnecessary level calculations
This provides greater flexibility when analyzing session-based activity.
Trading Safety Features
Frequency Limitation
New order frequency protection settings have been added.
Location: Options → Settings → General
Frequency Limitation – Max Orders Per Second
Defines how many orders may be sent per second. If the limit is exceeded:
Order submission is blocked
An error notification is displayed
Frequency Limitation – Pause Time (Seconds)
Defines how long order submission remains paused after exceeding the limit.
These controls provide an additional layer of protection against accidental rapid order submission.
User Experience Improvements
New Chart Loading Progress Interface
A redesigned progress interface has been added when:
Opening charts
Building charts
Loading historical data
The new interface provides clearer visual feedback during loading operations.
Support Improvements
Enhanced Contact Support Information
The Contact Support tool now automatically includes PC specification details when creating support requests. This allows our support team to:
Diagnose issues faster
Identify hardware-related limitations
Resolve technical problems more efficiently
No additional action is required from the user.
Summary
DeepCharts v15.6 introduces:
Full Depth DOM support
Big Trades rename (formerly Deep Trades)
New MBO-based Deep Trades indicator
Historical MBO storage support
Database migration and compression utility
FVG buy/sell color customization
NQ Efforts alerts
Trade Copier performance improvements
New screenshot workflows
Important Levels time filtering
Deep Print zoom and multi-column support
New Imbalance Tracker calculation modes
Candle duration display in On Candle Stats
Improved chart creation and grouping
Trading frequency limitation safety controls
Improved chart loading experience
Enhanced support diagnostics
Thank you for using DeepCharts

Deepcharts Team
·
Share this on
